
Almost every time I get into my Volt, I enter data into my iPad or iPhone in a Numbers spreadsheet to track my Volt’s performance. Mainly, I am doing this for two reasons, a) to see how temperature affects my mileage and b) to see if my projected savings (and therefore, cost justification) were either optimistic or pessimistic.
I freely admit this makes me a nerd.
Well, not just this, but it is definitely a symptom of my nerdiness.
If you’d like a copy of the spreadsheet for your own use, here is a blank Apple Numbers version and a blank Microsoft Excel version.
If you have your Volt set for metric dashboard readouts, I have files for that as well. Here is a blank Apple Numbers version (metric) and a blank Microsoft Excel version (metric).
NOTE: Unfortunately, my blogging application (WordPress) won’t allow me to upload a native Numbers file, so I had to Zip it. You will not be able to uncompress this on your iPad or iPhone. To get the file, click on the link from your personal computer (Apple or junk, er… Windows). Unzip the file there and then transfer the uncompressed file to your portable device. One way to perform the transfer, is to email the file to your portable device. However, if you open it in Numbers, even if it is an Excel file, it will be converted to Numbers. I prefer to run Numbers on my iOS devices, but it you want to keep the file in Excel format, there are apps that will allow that. One I have used in the past, is the aptly named app, Spreadsheet, it is $5.99 in the App Store.
Here’s how you fill in my spreadsheet:
The Green and Red areas are calculated for you. In other words, DO NOT enter data into the Green or Red cells!
The Grey area is for the date of the drive, on that row. Each row in the spreadsheet is one drive. If I drive to work in the morning and back home in the evening, I record those as separate drives (or rows) because the temperature change will be enough that it might affect mileage.
The White areas are optional. I enter information into them, in case I was to mine the data later. For instance, I am keeping an eye out for the best temperature ranges for mileage.
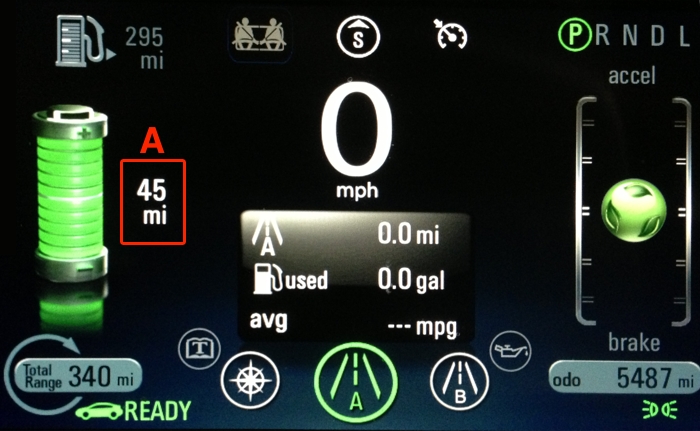
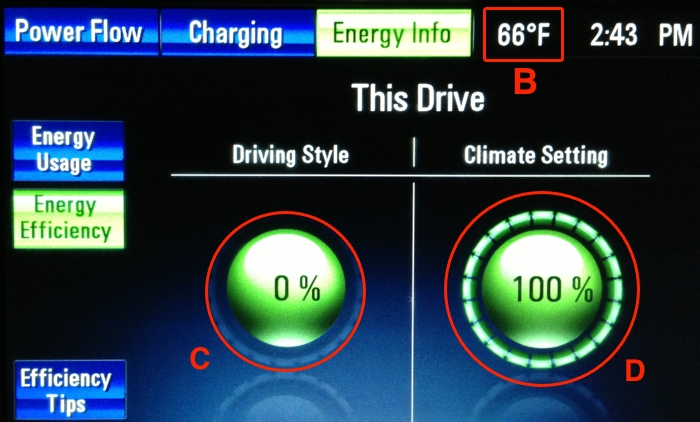
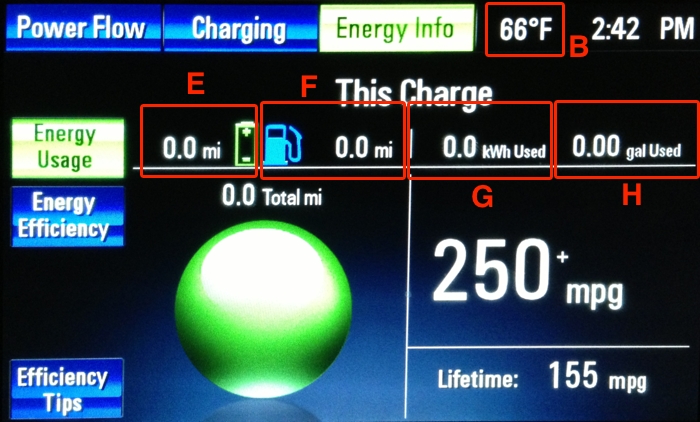
The Blue area contains the required cells for you to fill in. Each line represents one drive. There are other cells that are dependent on these cells. The data in the blue cells comes from one of these three displays (see images):
- Starting Electric Miles – Item A from the dashboard screen (behind the steering wheel).
- Ending Electric Miles – Same as Starting Electric Miles, except entered at the end of your drive.
- Temperature – Item B from the center stack display, on almost any screen.
- Driving Efficiency – Item C from the center stack display, under “Energy Efficiency.”
- Climate Efficiency – Item D from the center stack display, under “Energy Efficiency.”
- Actual Electric Miles – Item E from the center stack display, under “Energy Usage.”
- kWH Used – Item G from the center stack display, under “Energy Usage.”
- Gas Miles – Item F from the center stack display, under “Energy Usage.”
- Gas Gallons – Item H from the center stack display, under “Energy Usage.”
NOTE: Once you fill up all the exiting rows of this spreadsheet, you can add new rows by doing the following:
- When you add the new rows, there won’t be any formulas in the green cells of the new rows. Due to this, when you enter data in the blue areas, the green areas will stay empty. To fix this, tap the left green cell in the bottom row of your spreadsheet. A selection rectangle will appear around that cell with a list of commands. Ignore the commands and (1) drag the ‘handle’ on the bottom-right of the selection rectangle to the right, to select the entire green area of the bottom row. Once all four cells are in the selection rectangle, (2) tap on the “Copy” command.

- You may add multiple rows at one time. Don’t be shy! Do this by dragging the item, circled in red in this image, downward. (you make it visible by tapping on a cell near the bottom)

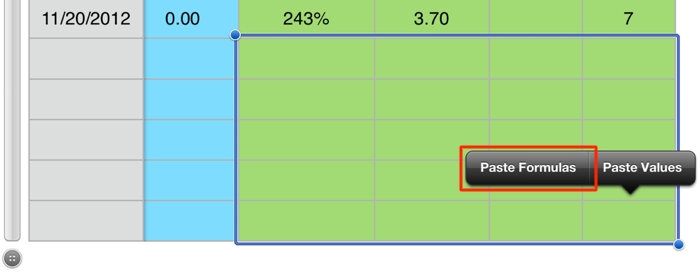
- Once the new rows are added, you just need to paste the formulas into the new green cells. Tap the upper-left green cell of the rows you just added. Once again, a selection rectangle will appear around that cell with a list of commands. Ignore the commands and (1) drag the ‘handle’ on the bottom-right of the selection rectangle down and to the right, to select the all the green cells of all the rows you just added. Once all the cells are in the selection rectangle, (2) tap on the “Paste” command.
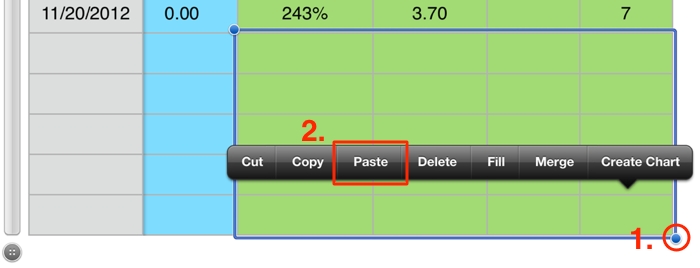
- Now you just have to let it know what you want to paste. A new list of commands will appear. Select “Paste Formulas.” The cells will remain blank for now, but when you enter data into the blue areas of the new rows, the formulas will calculate their values, and new values will appear in the green cells.


Get the app “Road Trip” for iPhone, very nice…
Looks like a great app, if it only could differentiate between gas and electicity usage. Thanks for the recommendation!
Hi Buzz, great blog. Just wanted to let you know that I think the RSS feed button may be broken, I went to subscribe and then there was an error.
I also wanted to let you know about a challenge we’re having for EV drivers, I think you would be a great candidate since you are already keeping track of your vehicle’s metrics.
If you are interested, you can find out more here:
http://www.fleetcarma.com/en/Programs/ev-challenge