GM is no longer publishing monthly sales figures for vehicles. I am trying to find reliable estimates to continue to publish sales data. This month, I am getting Volt/Bolt EV sales data from InsideEVs. They have been estimating Tesla Motors’ monthly sales for quite a while now.
The countdown to 200,000 plug-in vehicles, and the looming end of the $7,500 Federal Income Tax Credit (for three EV makers), just got very interesting. Tesla has stated a goal, for Model 3 production, of 5,000 vehicles per week. Their struggle to attain that production level has been well documented, with some even predicting bankruptcy for Tesla. Even Elon Musk joked about it on April Fool’s Day. That being said, Tesla produced a total of 6,150 EVs last month, bringing them within 15K of the 200,000 Federal Income Tax credit limit. Average production for their three current models, over the last year (10 months for the Model 3), has been 5,392 units per month. Using either figure, that means that, if there they continue at their current pace, Tesla should hit the limit in July 2018. If they hit the mark before July 1st, which I believe to be probable, Tesla could lose the tax credit as early as the end of September 2018, making the Model 3, at least for three months, much more expensive than the Bolt EV and Volt. We need the politicians to rethink the tax credit and how each manufacturer reaches the limit. I’ve written about this before.
April 2018 plug-in vehicle sales were almost universally down, with only one exception, the Tesla Model 3 (and its sales are estimated). I don’t have the Honda Clarity BEV numbers, which I combine with the PHEV version to give a total for all plug-in Clarity models, so that figure is not finalized yet, but last month, the BEV version only had 48 sales, so the chart isn’t off by much.
In the chart below, the April drop, in plug-in sales, is obvious.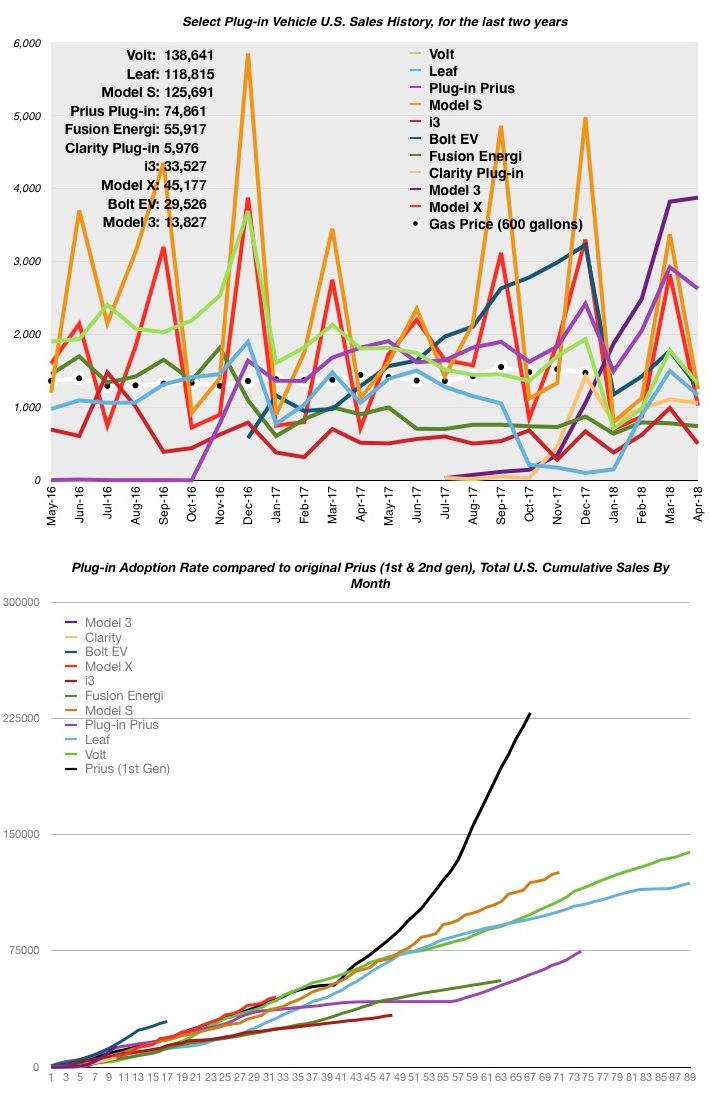 In the lower chart (above), we see the Bolt EV adoption curve, after an historical start, now tracking parallel to the the three leading plug-ins (Bolt EV, Volt and Leaf). The plug-in Prius adoption rate has accelerated, with the advent of the Prius Prime.
Here are the April 2018 sales figures, compared to the previous month:
- Chevy Volt: DOWN 26% (1,325 vs. 1,782) **estimated
- Chevy Bolt EV: DOWN 28% (1,275 vs. 1,774) **estimated
- Nissan Leaf: DOWN 22% (1,171 vs. 1,500)
- Plug-in Toyota Prius: DOWN 10% (2,626 vs. 2,922)
- Tesla Model S: DOWN 63% (1,250 vs. 3,375) **estimated
- Tesla Model X: DOWN 64% (1,025 vs. 2,825) **estimated
- BMW i3: DOWN 49% (503 vs. 992)
- Ford Fusion Energi: DOWN 5% (742 vs. 782)
- Honda Clarity BEV & PHEV: DOWN 14% (1,061 vs. 1,230) **BEV numbers missing
- Tesla Model 3: UP 1% (3,875 vs. 3,820)
In March, the average price of gasoline rose from $2.66 per gallon, at the start of the month, to $2.81 at month’s end, a 6% increase. The rise was pretty constant, through the end of the month. News media have been hyping gas prices a bit lately, with many showing gas prices, in California, going over $3.50 per gallon and predictions of over $4 per gallon there. Oddly, in this time of rising gasoline prices, Ford has announced it will stop making almost all its sedans/coupes. At least one editorial believes this move by Ford may put the company in peril.
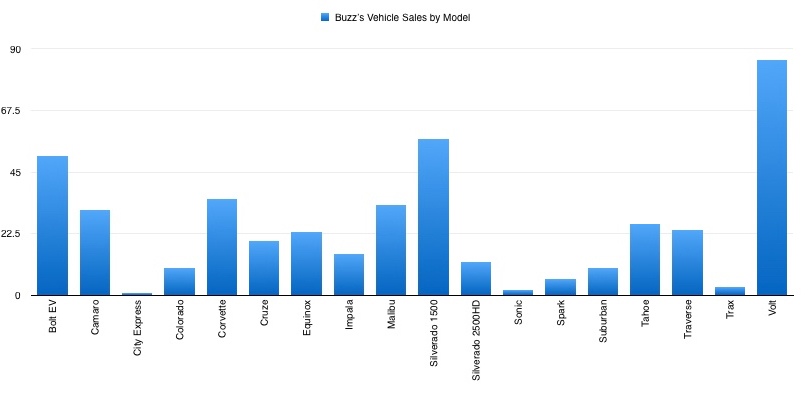
In total vehicle sales, April 2018 was about average for April. I sold 6 units.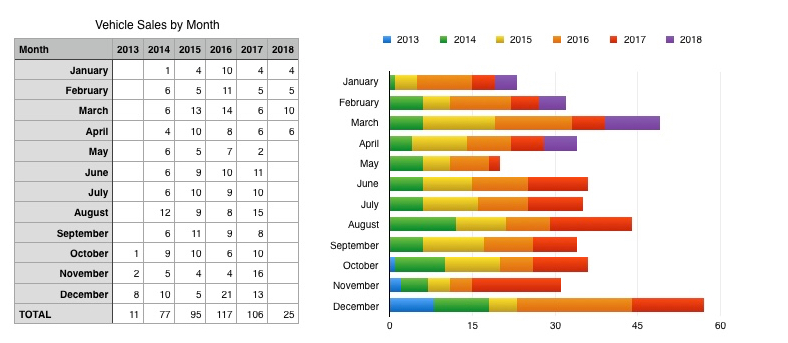 My six April 2018 sales were comprised of one Bolt EV, two Volts, two Malibus and a Tahoe. The rebound of interest in the Volt continues! The Bolt EV is still in 3rd place (51 units), in my sales, with the Silverado 1500 (57 units) in 2nd place and the Volt (86 units) in first. By vehicle type, my lifetime sales are unchanged from last month: 31% plug-ins, 19% SUVs, 18% pickups, 15% sports cars. The rest are sedans & vans (17%).
 In the chart below, the purple bars (2018 plug-in sales) show how odd the start to this year has been. When compared to the slivers of red below the purple bars (2017 sales), the change is astounding, over the first three months of 2018. However, April sales patterns seemed to go back to normal.
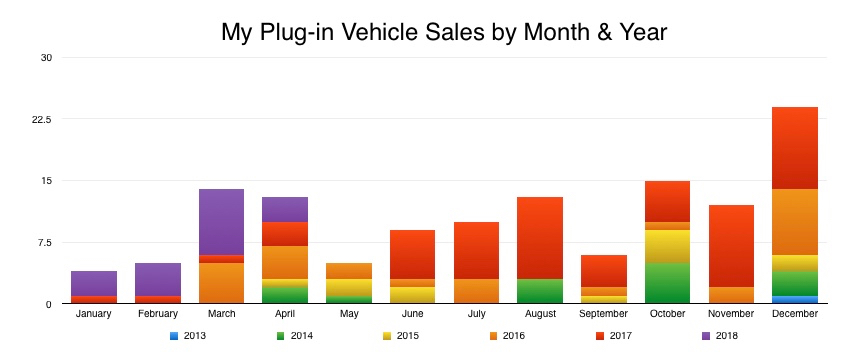 In the chart below, I’ve started to look at when plug-in vehicles sell for me. The first two months are definitely the lowest, with dips in May (oh joy) and September. 2018 definitely brought up the January & February numbers, but overall, the first two months are usually not good for plug-ins.
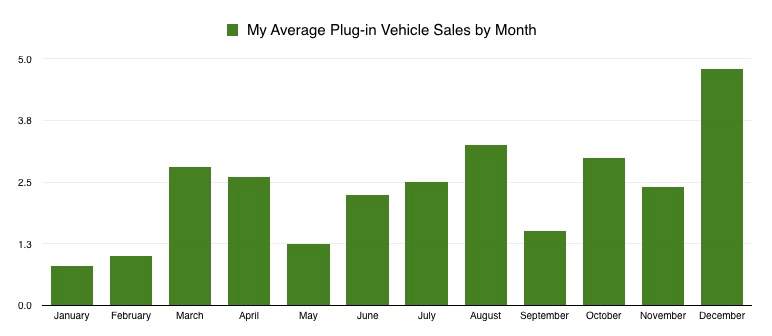
Plug-in sales, compared to the same month a year ago, were split:
- Chevy Volt: DOWN 27% (1,325 vs. 1,807)
- Chevy Bolt EV: DOWN 1% (1,275 vs. 1,292) **not available nationwide in April 2017
- Nissan Leaf: UP 10% (1,171 vs. 1,063)
- Plug-in Toyota Prius: UP 44% (2,626 vs. 1,819)
- Tesla Model S: UP 11% (1,250 vs. 1,125)
- Tesla Model X: DOWN 63% (1,025 vs. 2,750)
- BMW i3: DOWN 3% (503 vs. 516)
- Ford Fusion Energi: DOWN 18% (742 vs. 905)
- Honda Clarity BEV & PHEV: (was not available in April 2017)
- Tesla Model 3: (was not available in April 2017)

Comments