I keep thinking about the similarities between EV adoption and cellular phone adoption.
- Cellular Phones
- Cell phones were first adopted in large, urban areas due to lack of cell towers outside cities.
- Cell phones were originally thought of as toys for the wealthy.
- The cell phone industry started in the U.S.
- Asian countries started manufacturing them and, due to lower labor costs, began to dominate sales.
- As cell towers started appearing in rural areas, cell phone sales started growing outside large urban areas.
- Over multiple battery chemistry changes, battery call time and safety improved dramatically.
- Some manufacturers provided phones with swappable batteries. Others required the batteries to be changed by the manufacturer.
- Most people kept their land lines, even when they bought their cell phone, as a way to always be able to call where they wanted.
- After becoming comfortable with the new technology, many people stopped buying land line phones for their home, relying on just their cell phone.
- Electric Vehicles
- EVs were first adopted in large, urban areas due to lack of EV chargers outside cities.
- EVs were originally thought of as toys for the wealthy.
- The EV industry started in the U.S.
- Asian countries started manufacturing them and, due to lower labor costs, began to dominate sales.
- As EV charging stations started appearing in rural areas, EV sales started growing outside large urban areas.
- Over multiple battery chemistry changes, battery driving range and safety improved dramatically. (this is still ongoing)
- Some manufacturers provided vehicles with swappable batteries. Others required the batteries to be changed by the manufacturer.
- Most people kept their internal combustion engine (ICE) vehicles, even when they bought their first electric vehicle, as a way to always be able to travel where they wanted.
- After becoming comfortable with the new technology, many people stopped buying ICE vehicles for their families, relying on just electric vehicles. (like my family)
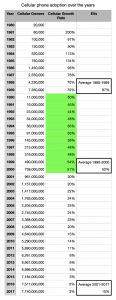
To the left is a spreadsheet I created using data from this website on cell phone adoption history. In the U.S. and specifically in Texas, EV adoption, year-over-year is increasing at close to 50% per year.
According to the website, EV adoption has around the same rate in year-over-year growth percentage as cell phones did from 1990-2000. (Coincidentally, I think I bought my first cell phone in 1990.)
There’s a lot of talk today about people not wanting EVs (usually by vehicle manufacturers and salespeople who don’t know how to sell them) but when compared to cell phone growth in the 1990s, they are increasing at about the same rate.
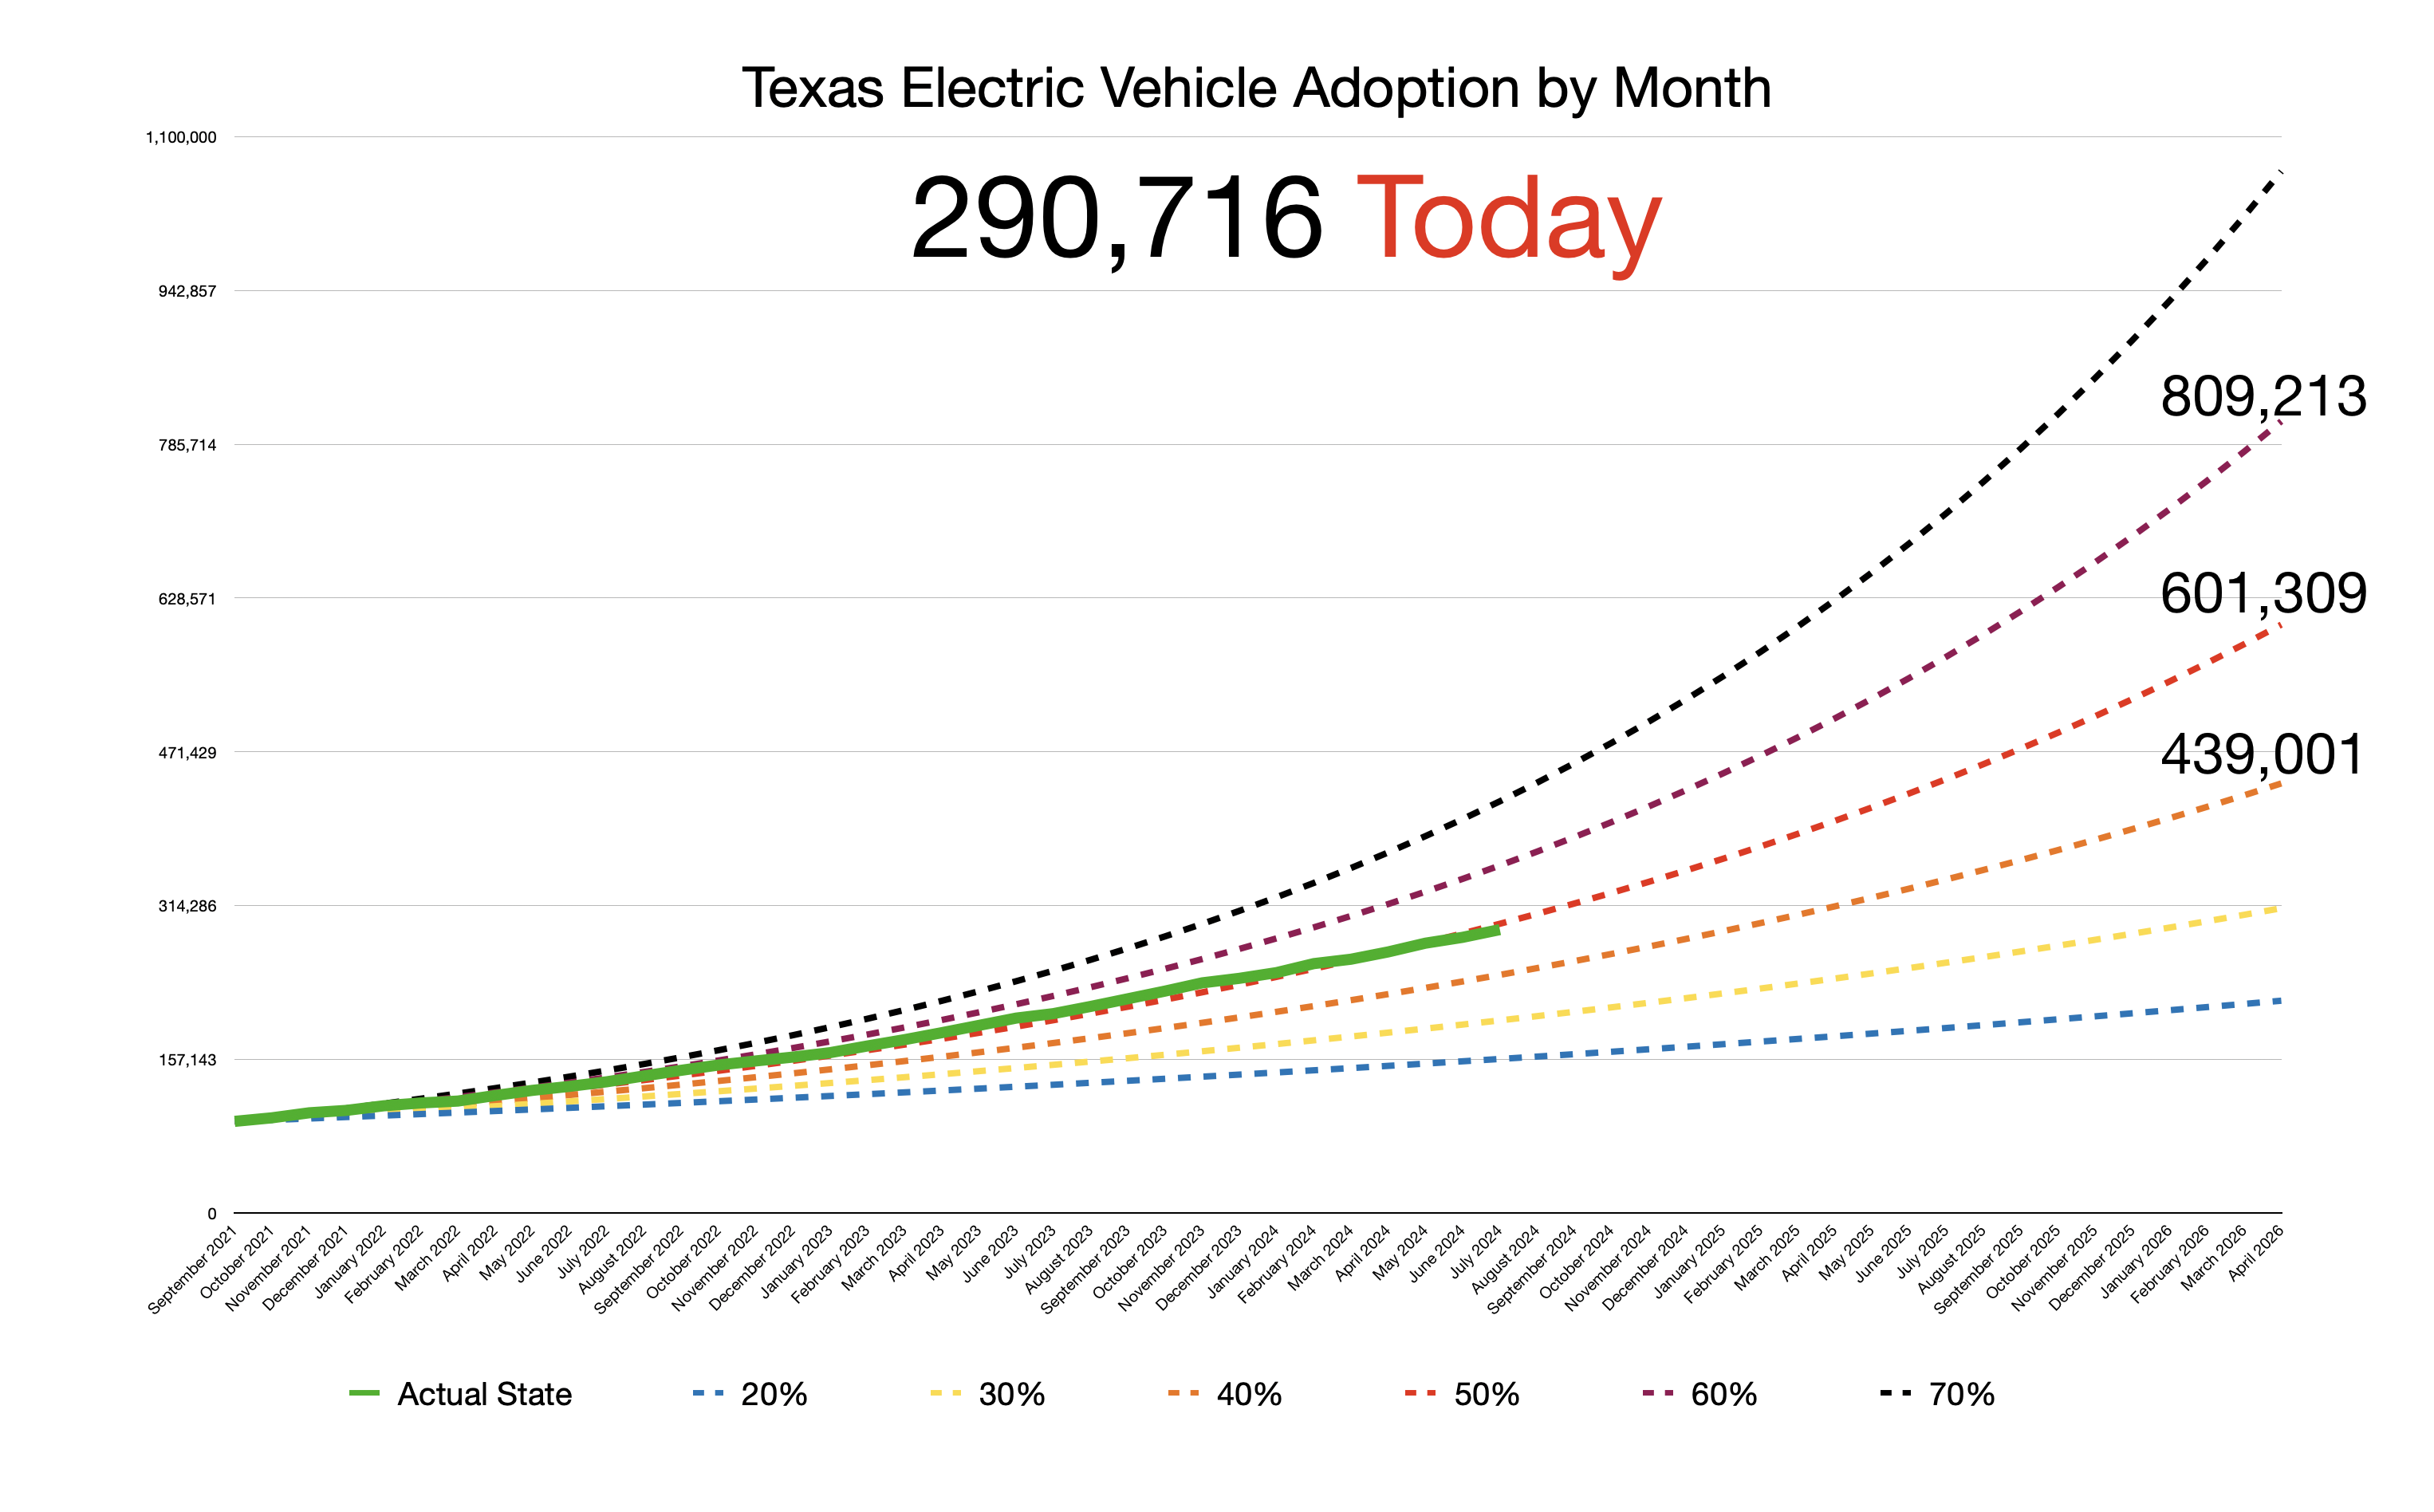
Today’s cell phone growth rate is about 3% to 5%, as the market is saturated. EVs are a long way away from that, much like cell phones were in 1990-2000. The chart below shows EV adoption in Texas from September 2021 to now. The solid, green curve is Texas’ actual EV registrations. The dashed curves are predictive curves for the various year-over-year growth rates of 20%, 30%, 40%, 50%, 60% and 70%. In the urban areas of Texas, growth is around 70%, but rural areas bring the average down to just under 50% consistently, from the start date of the data! Notice the green curve very closely follows the red dashed curve, which represents a 50% growth rate.
I’m afraid EVs are going to fade away exactly like cell phones did.  NOT!
NOT!
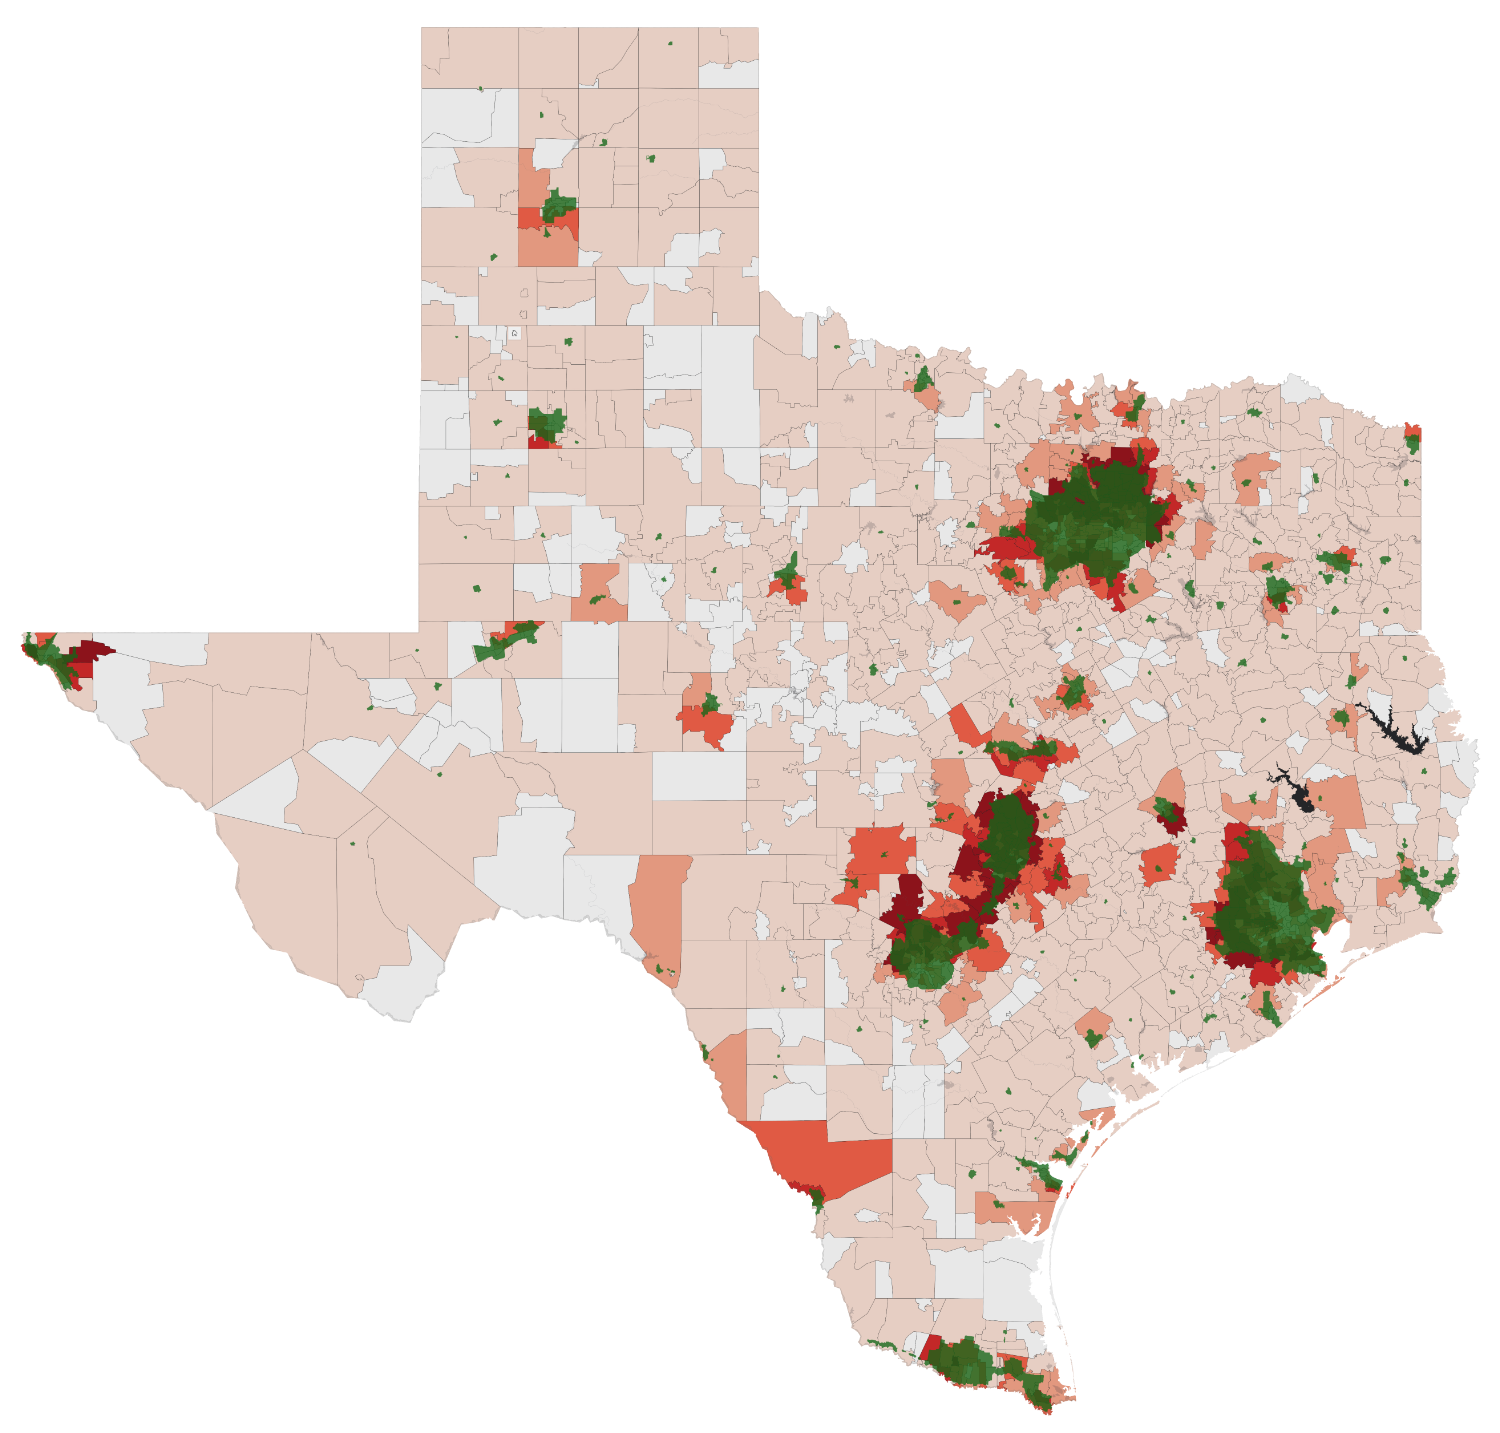
Take a look at the state map at the top of this page. That’s Texas EV adoption by zip code. The darker the red of the zip code, the higher the year-over-year adoption rate. The highest performing counties are increasing their EV registrations by over 70% each year. The green blobs overlaying the adoption map are “urban road areas,” according to the Texas Department of Transportation. As is obvious from the map, the heaviest EV adoption is in the urban areas, just like it was for cell phones. The white, rural zip codes have zero EVs registered, but look at all the non-white zip codes. Everywhere you see strong EV adoption, it started in an urban area (green blob) and spread outward from there. This pattern has been repeated around the world. Once EV adoption hits 5% to 7% of total vehicle inventory, adoption accelerates, because the odds are much higher that we have a trusted friend who got an EV and we can get honest, knowledgeable answers to our questions from them. That’s one of the things that’s been missing… until now. In May 2024, the percentage of vehicles that were electric in the U.S. was 6.8%. The only reason there’s been a slight drop in growth is that auto loan interest rates have spiked. The slight drop off began at the same time the rates went up.
Based on the trend shown below, I expect Texas to have an additional 60,000 EVs registered between now and the end of the year. That’s less than 6 months from today! That’s about 342 EVs sold every day (including Sundays) between now and then.
In my opinion, EV adoption is doing very well and is going to accelerate as more of our friends share their EV experience with the uninitiated.