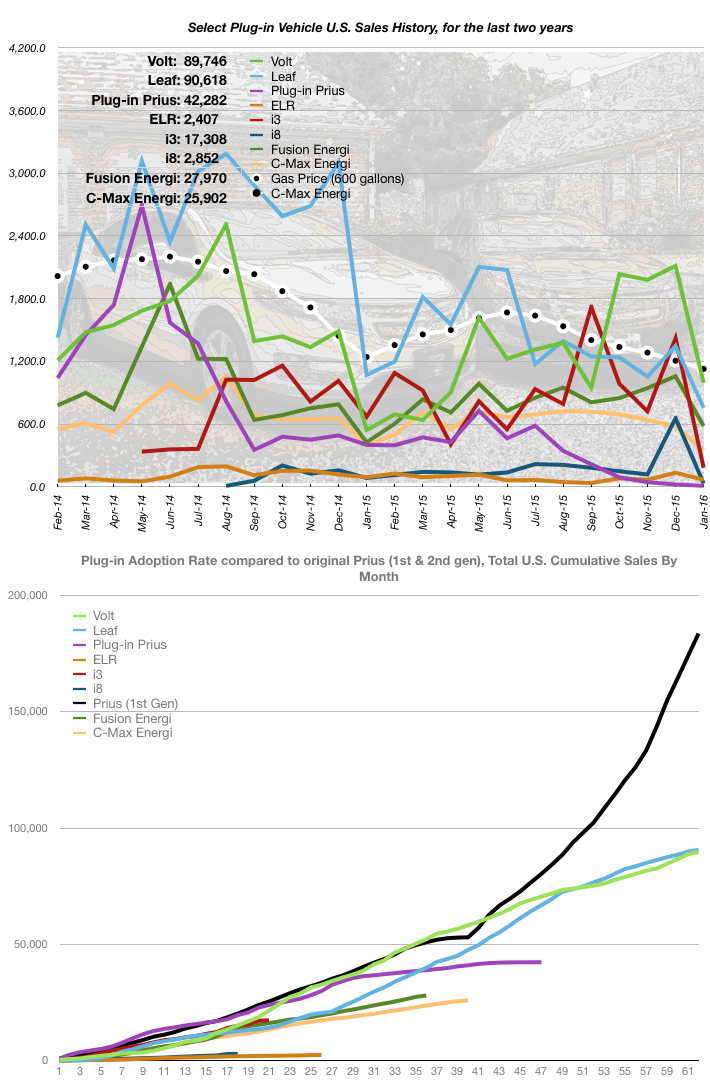
In January 2016, every plug-in vehicle I track, had sales volume lower than the previous month, reversing the previous month’s trend. Why? In my opinion, the government’s approach to plug-in vehicle subsidies fuels this. The best month to purchase a plug-in vehicle is December, because you can file for the Federal Income Tax Credit the very next month (or so). Conversely, January is the worst month, since you have to wait so long to file for the incentive. Here’s how January sales looked, compared to the previous month:
- Chevy Volt: DOWN 53% (996 vs. 2,114)
- Nissan Leaf: DOWN 44% (755 vs. 1,347)
- Plug-in Toyota Prius: DOWN 55% (10 vs. 22) **more on this shortly…
- Cadillac ELR: DOWN 50% (67 vs. 135)
- BMW i3: DOWN 87% (182 vs. 1,422) **what?!?!?!?
- BMW i8: DOWN 95% (32 vs. 656) **what (again)?!?!?!?
- Ford Fusion Energi: DOWN 45% (581 vs. 1,058)
- Ford C-Max Energi: DOWN 40% (350 vs. 579)
In January, the price of gasoline averaged $1.88 in the U.S. This is (once again) the lowest average price, since I began tracking it, over five years ago. This is not conducive to discussions of fuel economy with potential buyers.
The Chevy Volt had pretty good month, posting 996 units sold, which was the second best January sales total ever (#1 was January 2013). The Volt has closed on the lead built up by the Nissan Leaf, over the last ten months, to less than 900 units. February sales will still be hindered by the fact that the currently available 2016 Volt is only sold in 11 states. Hopefully, before the end of February, the 2017 Volts will begin arriving nationwide and give us a real picture of Volt potential across all 50 states.
The Nissan Leaf experienced a 44% decrease, compared to the previous month, which had been the best the Leaf had done in five months.
The plug-in Prius dropped 55% to an all-time monthly low of just ten units sold. I’ve been expecting the demise of this car for quite a while now, and Green Car Reports published a report stating the Prius line was to be thinned out. However, they also said, “…the future of the Prius Plug-In Hybrid is assured.” Then added, “Toyota ended production last summer, saying there was sufficient supply of the plug-in Prius to last until near the launch of a new model this year.” Whaaaaaat???
BMW had a very rough January, at least as far as monthly sales increases goes. The i3 was down 87% and the i8 a staggering 95%! In all fairness, BMW had a blowout December, so there had to be a decline. That being said, the decline is staggering, representing the all-time lowest monthly sales volume for the i3 and the second-lowest for the i8, with the only lower monthly total, being the first month it was available.

The adoption curves, in the lower graph, continue to concern me each month. The Volt and Leaf adoption curves continue to diverge from the original Prius’ curve more every month. The very low price of gasoline surely plays a role in adoption of plug-in vehicle, but it doesn’t have as much impact on second or third purchases, because those of us who’ve made the plunge seem to love the quiet electric drive, the sprightly acceleration and the convenience of refueling at home. As such, I still believe this revolution will continue, although new buyers will be harder to convince than they were when gasoline was $4 per gallon.
January traffic at my dealership was dismal. Although I had my best January yet, it wasn’t something to crow about.
Sales, compared to the same month a year ago, were almost all down, with the exception of the Volt and the Fusion Energi. The BMW i3 & i8 had substantial decreases, compared to a year ago, but I have no data as to why. Being the only European vehicles I track, I wonder if there was a German holiday that shut down production…
- Chevy Volt: UP 84% (996 vs. 542)
- Nissan Leaf: DOWN 29% (755 vs. 1,070)
- Plug-in Toyota Prius: DOWN 98% (10 vs. 401) ***this is just getting cruel, Toyota!
- Cadillac ELR: DOWN 27% (67 vs. 92)
- BMW i3: DOWN 73% (182 vs. 670)
- BMW i8: DOWN 62% (32 vs. 85)
- Ford Fusion Energi: UP 36% (581 vs. 426)
- Ford C-Max Energi: DOWN 11% (350 vs. 395)
