This month is the 100th month that I’ve tracked selected plug-in vehicle sales.
As a reminder: The federal government will halve the income tax credit available to GM plug-in buyers again, on October 1st of this year, so if you want to purchase a Volt or Bolt EV, get one before October 1st!!!  Classic Chevrolet now has 39 Bolt EVs on order. Seventeen have been built. One of these has arrived and we are awaiting the rest. Next week, we have another twenty-two that are scheduled to be built.
The Model 3 sales curve, although still well above all other plug-in vehicles I track, has dropped significantly. I believe this has two primary reasons, a) Tesla had the tax credit halved, beginning on January 1st and b) the backlog of orders has fallen from the stratospheric heights it enjoyed earlier, as order deliveries outpaced new orders. No other plug-in vehicle has come close to that kind of sales performance. Even with the precipitous (and completely normal) January/February slump, its sales volume last eleven months has still been higher than any plug-in vehicle ever.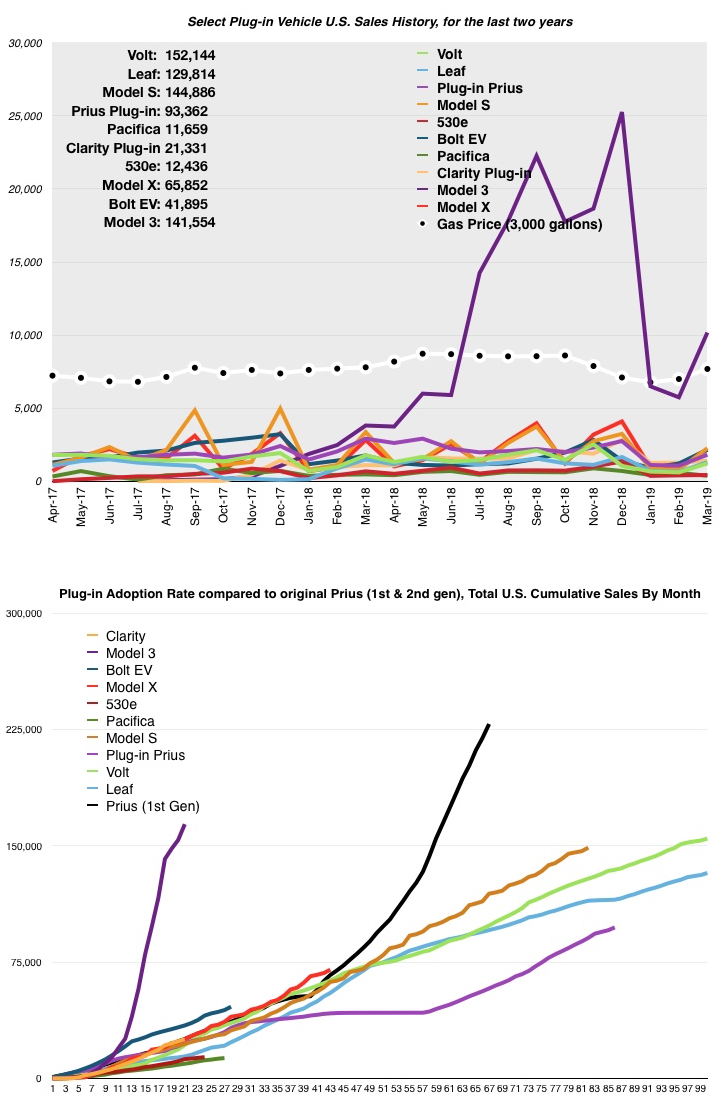 Below, are the March 2019 sales figures, compared to the previous month. Their sales were almost all up, with only one, the Chrysler Pacifica, down.
- Chevy Volt: UP 100% (1,230 vs. 615) **estimated
- Chevy Bolt EV: UP 77% (2,166 vs. 1,225) **estimated
- Nissan Leaf: UP 101% (1,314 vs. 654)
- Plug-in Toyota Prius: UP 69% (1,820 vs. 1,075)
- Tesla Model S: UP 184% (2,275 vs. 800) **estimated
- Tesla Model X: UP 98% (2,175 vs. 1,100) **estimated
- BMW 530e: UP 5% (436 vs. 414)
- Plug-in Chrysler Pacifica: DOWN 35% (383 vs. 589)
- Honda Clarity BEV & PHEV: UP 10% (1,403 vs. 1,281)
- Tesla Model 3: UP 77% (10,175 vs. 5,750)
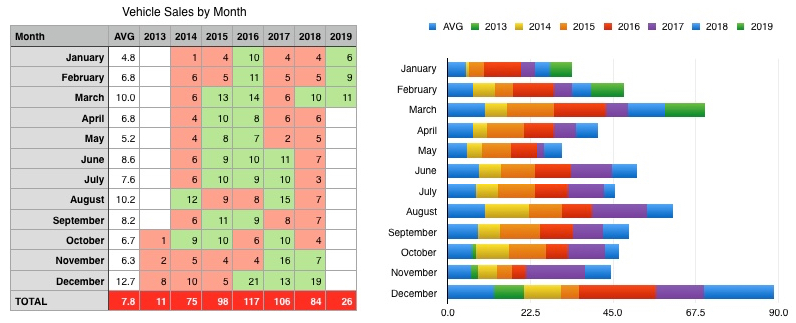
Gasoline prices rose steadily all month, continuing a three-month trend. March gasoline prices started at $2.429 per gallon, less than 1¢ lower than February’s ending price of $2.432 per gallon. The price ended 27¢ above the price at which it started, ending at $2.694.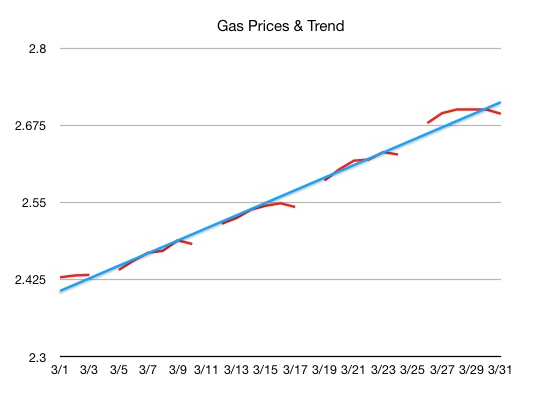 My vehicle sales, in March 2019, were above average for March. In fact, this was my third-best March ever and March has traditionally been one of my better months. The table to the left of the chart has cells highlighted in red, if my sales were below my historical average for the month and green, if above average. March continued a five month trend, in which my monthly sales were above my historical average for that month.
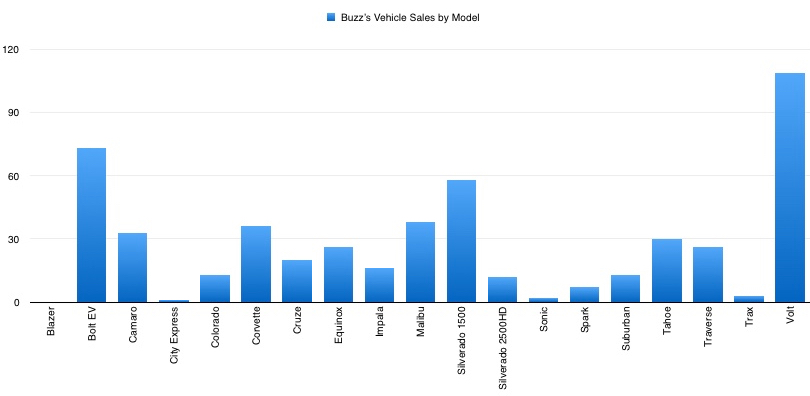
 My eleven March 2019 sales were comprised of six Volts, a Bolt EV, a Suburban, a Traverse, an Equinox, and a Tahoe. It’s interesting to me that, other than the Volts, my sales reflected what Mary Barra said about car versus SUV/crossover demand. Everything I sold, other than Volts were SUVs and crossovers. (GM considers the Bolt EV a truck)
 My plug-in sales, are continuing well, which is NOT normal for March. In fact, March 2019 missed equalling my best March EVER, for my plug-in sales, by only one unit.
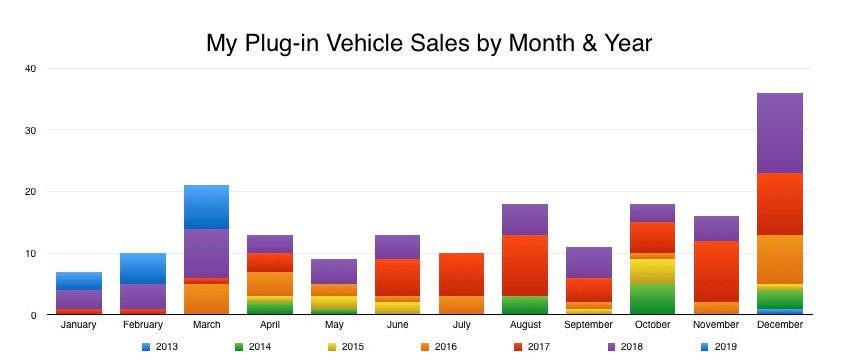
As can be seen in the chart above, my plug-in vehicle sales in the last two years have been significantly better, in January through March, than in years prior to that. It will take a while before the chart above that one starts to show a change, since it is average sales, over a 6 year period.
The seven in March 2019, bested March 2018 by only one plug-in. Just like in 2018, the vast majority of my plug-in sales were Volt. In 2018, the newness of the Bolt EV was wearing off a bit and people’s thoughts returned to the Volt. In 2019, the last Volt had already rolled off the assembly line, so people were frantically looking for a Volt, before they all disappeared, before the income tax credit was halved and before the Texas plug-in vehicle rebate ended.
If you noticed, in the chart above, that March 2016 was another good month for my plug-in sales, I can explain that. It was that the debut of the 2nd generation Volt in Texas occurred that month. Texas was not included in the 2016 model year, so Texans had their first chance to get a 2nd gen Volt, in early March 2016. I got my 2017 on the 3rd of that month…
Plug-in sales, compared to the same month a year ago, were mixed, with most dropping and only three increasing:
- Chevy Volt: DOWN 31% (1,230 vs. 1,782)
- Chevy Bolt EV: UP 52% (2,166 vs. 1,424)
- Nissan Leaf: DOWN 12% (1,314 vs. 1,500)
- Plug-in Toyota Prius: DOWN 38% (1,820 vs. 2,922)
- Tesla Model S: DOWN 33% (2,275 vs. 3,375)
- Tesla Model X: DOWN 23% (2,175 vs. 2,825)
- BMW 530e: DOWN 37% (436 vs. 689)
- Plug-in Chrysler Pacifica: DOWN 20% (383 vs. 480)
- Honda Clarity BEV & PHEV: UP 27% (1,403 vs. 1,109)
- Tesla Model 3: UP 166% (10,175 vs. 3,820) **Model 3 debuted in July 2017 and struggled with “production hell” for 10 months or so.
On a final note, a comment on Facebook asked me to comment on where I obtain my sales figures. I use several sources, including InsideEVs, GoodCarBadCar, CarSalesBase and hybridCars.

