
If you would like to contact our solar panel provider, click here to email them.
It has been 150 days, since our solar panel system went on line. We started generating electricity from solar energy, on December 21st. The 150 days ended on today. Our solar panels generated a total of 5,387 kWh or, in other words, almost 5.4 megawatts. These 150 days are not the most conducive to energy production, since they began with December 21st, exactly on the Winter Solstice of 2016. As you may know, the Winter Solstice is known as “the shortest day of the year.” It’s really the day with the shortest period of sunlight. You may also think that means the day of the least solar energy generation. That, it is not, as overcast longer days can result in lower energy generation. With this in mind, if we just divide the total amount of energy generated so far, by 150 days and multiply by 365 days (to get an estimate of annual production), we would arrive at a figure of 13.11 mWh per year. Since these 150 days are not average, over the year, we can expect our total annual production to be more than that. Our solar panel provider estimated that our annual production would be close to 16 mWh. I am not sure it will get that high, but if we average both these figures, a compromise estimate of 14.55 mWh is produced. More on this later…
Our highest single day of energy generation so far, was May 4th. On that day, our solar panels generated 60.41 kWh, which is just slightly more than the Chevy Bolt EV‘s battery capacity. The least energy generated in a single day, so far, was 4.4 kWh on December 23rd. Another low production day was March 5th, when 5.66 kWh were generated. As you can see, daily production can vary greatly, as is illustrated in the upper chart below.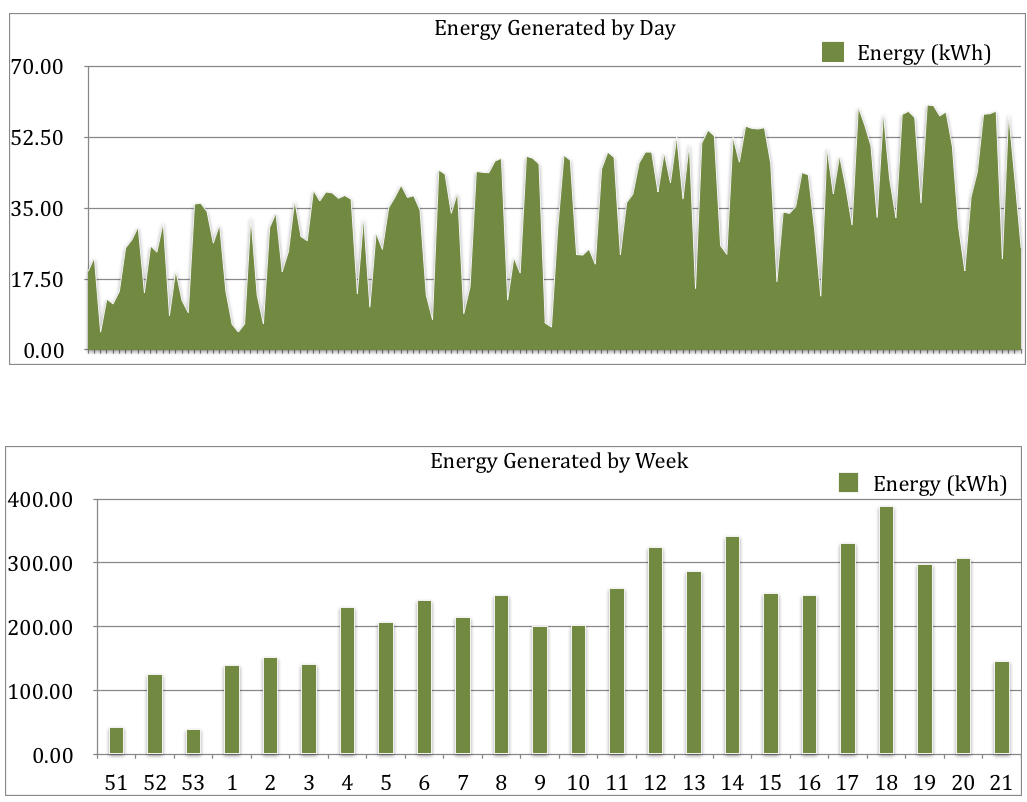 As you start to look at larger blocks of time, the pattern smoothes out. In the lower chart, by looking at weekly system output, you can see the trend toward higher energy generation. Weeks 21, 51 & 53, were obviously not a full seven days.
To see the pattern a little better, we can look at it by calendar month (below). The current month only shows the first 19 days, resulting in 1,090 kWh. Using the daily average generated in the month, I expect May’s result to be the highest on the chart at approximately 1,778 kWh, a total so high, as to be off this chart.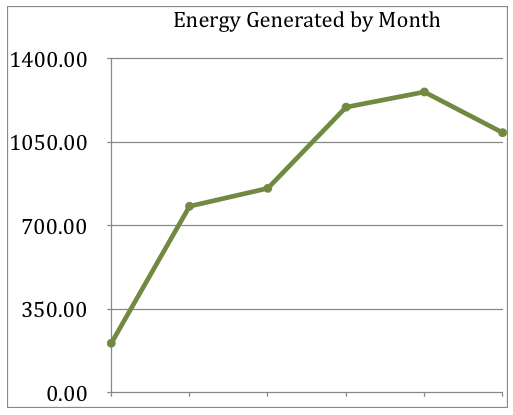
How was last month’s bill affected by the solar panels? I’m glad you asked! We used 1,676 kWh total. Our average usage for this month, over the last 3 years has been 1,492 kWh, but this month has been warmer than usual. Of this amount, 433 kWh came from our electricity provider, Green Mountain Energy and 1,243 kWh came from the solar panels. We generated 74% of the electricity we used. Our Green Mountain Energy bill was $20.57. The payment on the solar panel system is $154.54. So, our total electric cost was $175.11 last month. If we didn’t have the solar panels, our bill would have been $133.96, so we overpaid by $41.15 last month. (this will vary, so more on that later)
Green Mountain Energy, currently  charges us 11.6¢ per kWh, the “solar rate” we got, when we switched providers. They buy any overproduction at the same, retail rate in monthly (billing cycle blocks). Before we got on the “Solar Buy-Back Plan,” our rate was 8.5¢ per kWh. This means they are actually buying back at somewhat less than retail, since the rate was lower when we were on a normal energy rate plane. However, when I created a spreadsheet, to check the financial soundness of getting solar panels, we still came out ahead, when compared to a company that charged the lower rate but bought back overage at wholesale, instead of retail. It’s jumping through math like this that discourages people from getting solar panels, because they just can’t tell if it makes economic sense or not.
As you may know, I love making spreadsheets and performing analyses, so…yay!
Our solar panels (38 in all) cost $33,480, including permits and installation. The federal government’s tax incentive for solar panels is 30%, or in our case $10,044, leaving us with a cost of $23,436 in out-of-pocket expenses. One really cool feature of our solar financing plan, is that the first payment is due one year after the panels are installed and operational. This gives the buyer time to realize the tax credit and pay it into the loan, resulting is a monthly payment, based on the system price, after the tax credit is applied. We financed the panels over 20 years, resulting in a monthly payment of $154.54.
So, the big question is: Are we paying more for electricity + solar panels per month that we were for electricity alone? We still don’t know definitively, and won’t until we’ve analyzed a full year of data. However we can now start to make an educated guess.
If the solar panel company is correct, and our solar panel system generates 16 mWh of electricity over the full year (and that is still a distinct possibility), the total cost we’ll pay per month for electricity + solar panels, would be 13¢ less, than just buying electricity from our provider at the higher rate they’re charging now. However, if we compare the total amount we were paying on the previous plan, we could pay as much as $61 per month more, on average, than we were, which is about a 36% increase. We expected to pay more, during the first few years and reap the benefit of lower overall cost, as energy prices go up, over time. Again, only time will tell. The rate we’re paying now per kWh is approximately the same as the U.S. national average rate per kWh.
Here’s what we feel we are getting for this:
- We generate ZERO pollution, for the energy we use during the day, because we generate it from the sun. Even though Green Mountain Energy provides “100% renewable energy,” during times of low winds or low solar generation, Green Mountain Energy has to buy energy from non-renewable sources, to keep the lights on, which do generate pollution. To make the claim that they’re 100% renewable, Green Mountain will purchase energy from other renewable energy companies, to offset the dirty energy they had to purchase during these shortages.
- If we add a battery backup to the system, these benefits would continue after sunset, when the batteries would continue to provide electricity, after sunset, or during a blackout or brownout.
- THIS IS PROBABLY THE BIGGEST FACTOR: On average, in Texas, solar panels add $15K of value to the home, when it comes time to sell. Once this is taken into account, the solar panels really only cost us $8,436, that $61 per month is eliminated. Our system is larger than the average residential system installed in Texas, so the actual cost may be even lower than that! This means that we’re really at break even now, with additional savings as energy prices rise, over time.
In late December, I will have a full year’s worth of data and will revisit this, but at this point I think we made a very good financial (and ecological) decision.
If you would like to contact our solar panel provider, click here to email them.