***NERD ALERT!!!***
I’ve been waiting a year for this: The analysis to see if solar panels were a good idea or not. If you don’t care about the technical details of the math/spreadsheet, just jump ahead to the “RESULTS” section below.
Oddly, it was during the Winter Solstice that our solar panels were turned on, odd because that’s the shortest day of daylight all year long. I’ve been waiting for a year to see where we are, in energy generation, in order to understand if this was a good investment for us. To make it easier for me to analyze our results, I downloaded solar panel data from January 1, 2017 through December 31, 2017. What follows is what I found.
Here’s how our generation went, over the previous year: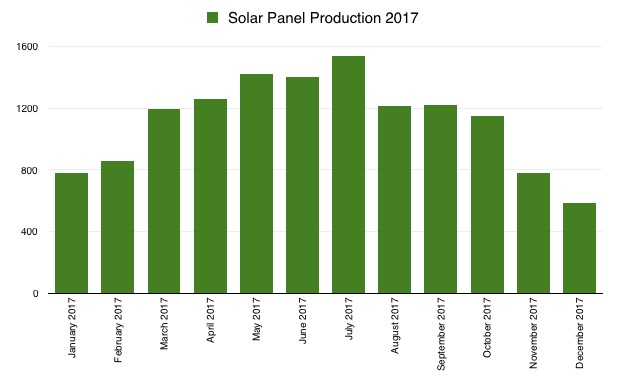 As expected, there was more energy generated during the Summer than the Winter. It’s pretty simple to understand: The sun is up longer each day, during the Summer (in the Northern Hemisphere), due to the Earth’s axis tilt, in relation to the plane of its orbit around the sun. This was expected and the vendor’s projections showed this was going to happen. The vendor we went with, estimated we’d generate 15,810 kwh per year.
Our average annual usage, over the three years we’ve lived at this residence, is 23,766 kWh per year. In 2017, we used 25,001.974 kWh, or about 5% more than an average year.
Our actual energy generation was 13,408.39 kWh, a 2,401 kWh shortfall, or about a 15% shortfall, from the estimated production our vendor expected. We used 17,477.092 kWh from the grid and sold 5,883.508 kWh back to our electricity provider, Green Mountain Energy. This resulted in a net usage, from the grid, of 11,593.584 kWh. We selected Green Mountain Energy, as our electricity provider, because they buy our surplus generation at the same price that they charge for electricity they sell to us. This seemed to make it easier to do a year-end analysis. They upped our rate from 8.6¢ per kWh to 11.5¢ per kWh for their “Solar Buy Back” plan. Should we have stayed with the lower rate and given them our surplus production for free? There was no way for me to estimate this. Also, they didn’t mention this when we signed up. The salesperson, although we mentioned our new solar panels several times on the phone call and asked about solar buy-back, failed to put us on the correct plan. We were under the impression we were getting the electricity at 8.6¢ per kWh. Two months into the contract, I called to ask why I wasn’t seeing any solar buy-back on our bill. That’s when they realized we were on the wrong plan. I was not pleased to hear this.
Part of the solar panel installation included having a new meter installed. The “smart meter” allowed for electricity to be tracked as it flowed from the grid into our home and from our home to the grid (when the solar panels were producing more electricity than our home was using). Both my electricity provider and I could access this data in a CVS file format, perfect for importing into a spreadsheet for analysis.
At the end of the first year, I downloaded the CVS file and it was GIGANTIC. The original spreadsheet, covering the entire year in 15 minute segments was over 70,000 rows long. generation (solar panel surplus) and consumption (from the grid) were on separate rows. For the purposes of analysis, I combined the two rows for each 15 minute snapshot into a single row, reducing the number of rows to only 35,041 rows. Only?!?!?
My first question was whether the electric company had cheated me by knowing that most people won’t check to see if they actually bought as much surplus as the panels created. The electric company’s website allowed me to see my daily use of their electricity as monthly bar graphs, but did not let me download it as a spreadsheet. I had to click on each day’s bar, in the graph, to see the usage. I then manually entered that day’s value into a new column I added to my spreadsheet. To compare with the 15 minute intervals, I had to add all the increments for a day (96 rows for most days) so that I had comparable numbers. I then added a new column to add those results. I added a test equation for each day to see if what the electric company said we used matched what the smart meter said we used. I also added a column for each day to total up the surplus electricity we generated (if any) for all the 15 minute segments of the day, in order to see what we were selling back to the grid.
After all that work, I found that Green Mountain is a trustworthy company. But there was an issue. The work was so laborious, that I tried copying the equations from one day to the next. Once I had a month’s worth of equations, I tried copying and pasting a month at a time. I felt I must have messed up somewhere because the equations were supposed to end up on the row of the last 15 minute segment for each day, but it didn’t work that way. What had I done wrong???
I fixed the error when it first occurred and then tried copying and painting a month at a time again. When I had completed the year, I noticed the error had occurred a second time! As I scrolled through the data, I found one day where four rows seemed to be repeated, (but the usage values were different) and I found another day where an entire hour was missing. On March 12th, it jumped from 2:00AM to 3:00AM and on November 5th, the hour from 1:00AM to 2:00AM was duplicated. What the hell???
D’oh!!! It was due to Daylight Savings Time starting and ending!
Once I had the spreadsheet completed, I could finally start to evaluate electric provider pricing plans to determine (based on real world data) which pricing plan was most beneficial to us. Here’s what I found. Green Mountain’s Solar Buy Back, even though at a higher kWh rate, saved us about $21 per month, over the lower rate that did not buy back surplus energy.
My next stop was Texas’ Power To Choose website. In Texas, electricity providers are, by law, broken up into three groups: power generation, power delivery and power retailing. In my case Green Mountain Energy was my electricity retailer. Oncor is the company that maintains the power lines and is paid by the kWh to transfer electricity from the generation plant to my home (this charge is added to my electric bill from the retailer). Green Mountain, in turn buys electricity from the power generation plants. This split of the industry has increased competition and helped keep costs lower than in other areas of the country, but also makes it difficult for EV charging networks, because they cannot sell electricity, by the kWh, to the end user. They have to charge by the time your EV is plugged in. This means slower charging EVs are penalized. They may get the same amount of electricity, but pay more because they are connected longer to get it.
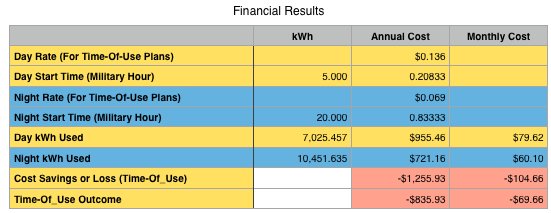
I knew of companies, like TXU, that offered time-of-use plans, giving the consumer a lower price at night (when grid demand is lower) than during the day (when demand is higher). This called for a new section of the spreadsheet, where I could differentiate between night kWh and day kWh. I checked the TXU website and found that the customer can pick one of three start times for the night rate. The duration of the night pricing would be the same, eight hours. At night, TXU’s electricity is free but, during the day, their price per kWh is higher than companies that don’t differentiate between day and night rates. The new section of the website would allow me to analyze this to compare electric rates. Unfortunately, the free nights plan does not buy my excess solar generation, so that had to be taken into consideration as well. As I read about the TXU plan, after adding the new section to the spreadsheet, I realized their electricity is 90% from non-renewable sources, so that plan would not work for us. It was the lowest priced plan I evaluated with the spreadsheet, besting our Green Mountain plan by about $32 per month on average.
I continued to search for electricity providers on the Power To Choose site, looking for companies that offered time-of-use plans that sourced their energy from renewable sources. There was only one: a company named “Volt.” Imagine that! Volt designates twelve full hours at night rate, but it’s 9:00PM to 8:59AM. The consumer cannot pick the start time. Their night energy is not free, but is at a lower rate than daytime. So, once again, it was time to add functionality to the spreadsheet. This proved to be higher than our Green Mountain buy-back plan by about $$5 per month. This meant that, without the ability to predict production or day/night balance, we had selected the best plan that also provided 100% renewable energy, when provided by the grid.
Adding this spreadsheet capability gave me more insight into my electricity usage as well as the ability to compare these providers to one another effectively.
RESULTS
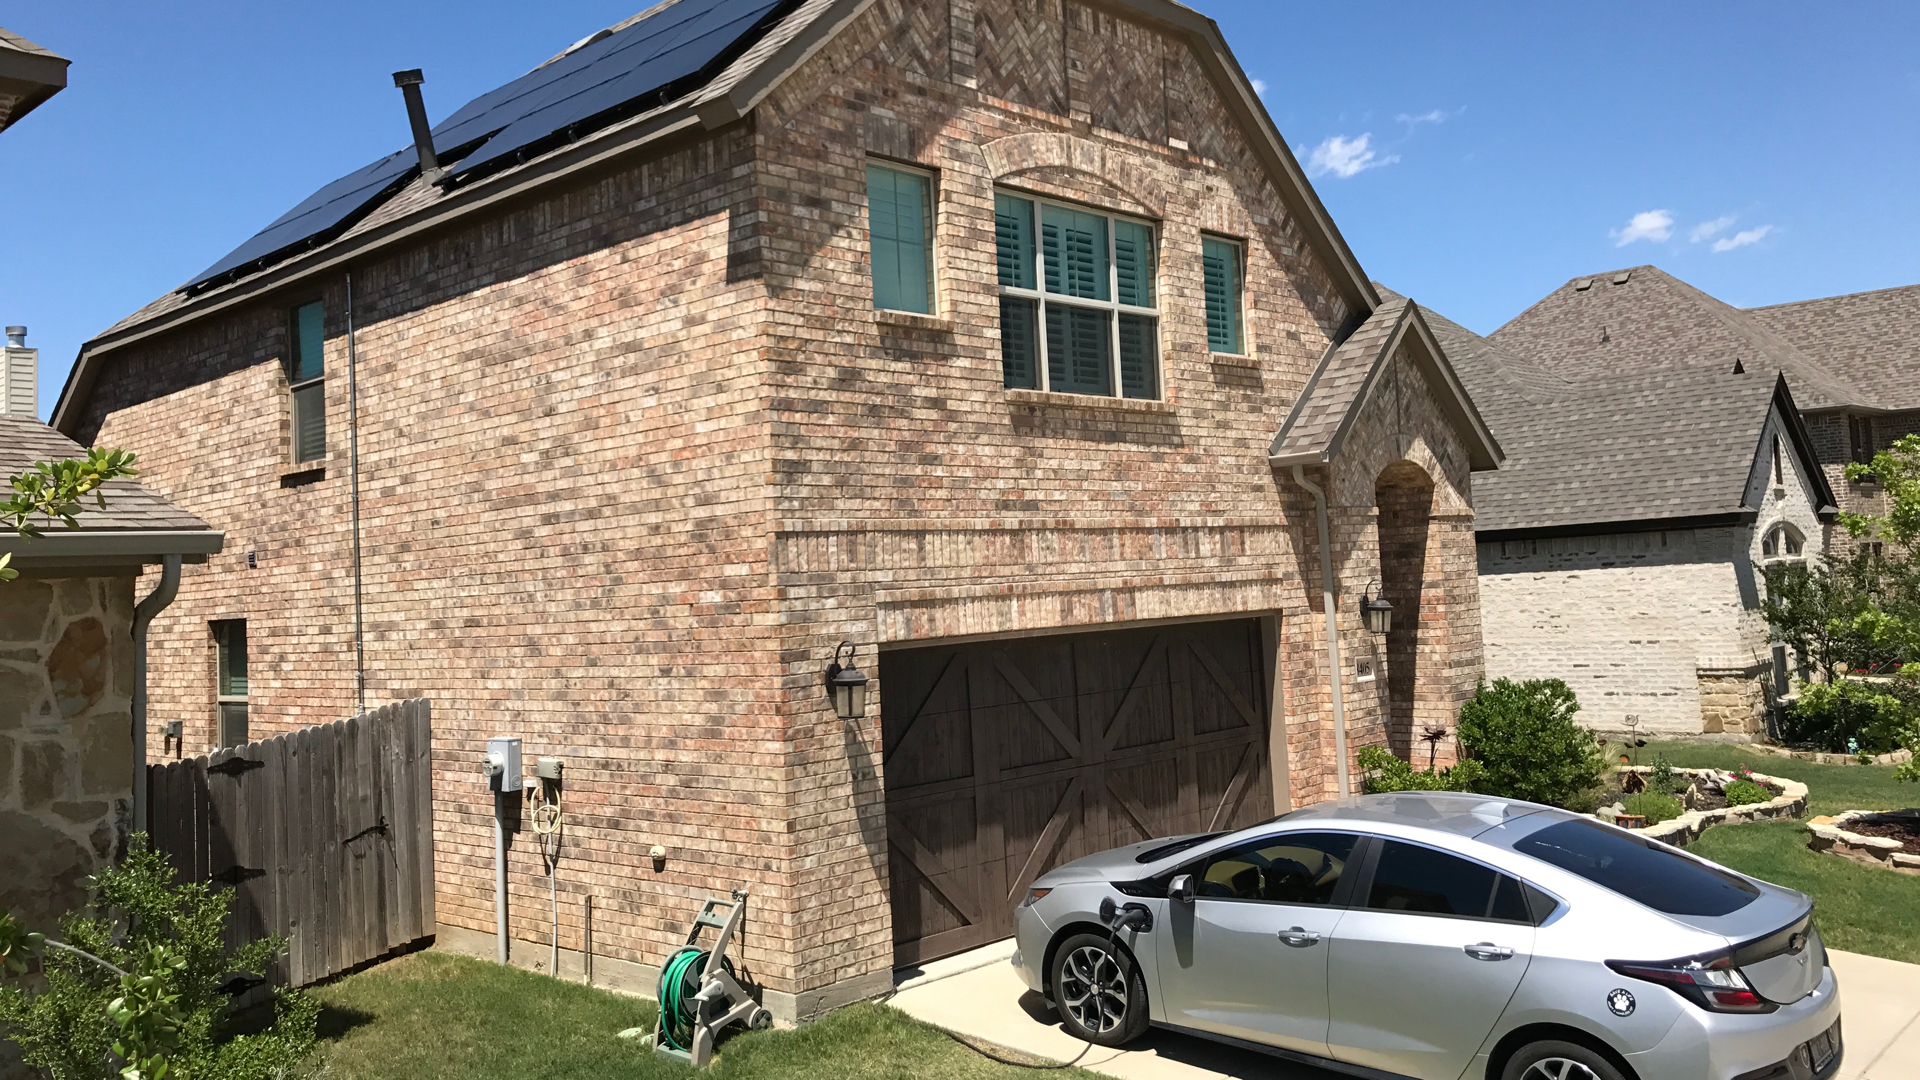
As I mentioned before, solar panels generate more energy in the Summer than Winter, because the sun is visible much longer then. Here’s the breakdown of our energy usage from the grid and from the panels, by month: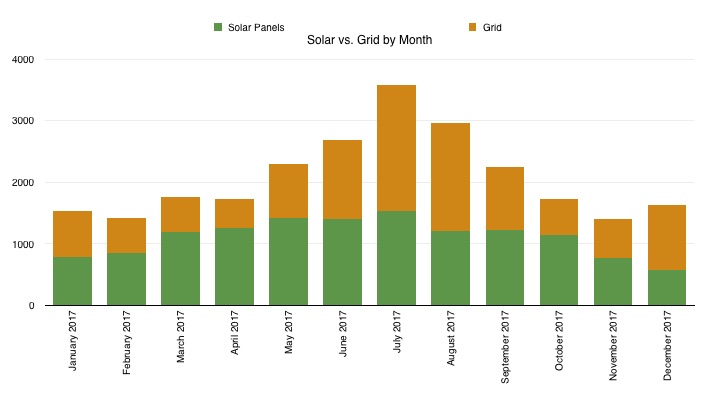 It is also important to have your panels facing south. The front of our house faces south, but as you can see in the first picture in this post, the roof does not slant down toward the front of our house. This means each bank of panels only produces near full capacity for about half of each day.
As you can see from the chart above, both total usage and solar generation were highest in the Summer. Our heating system uses natural gas, so our electric usage drops precipitously in the Winter. Here’s the numbers: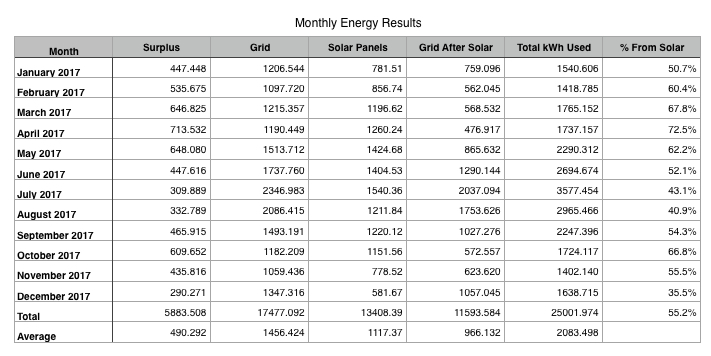
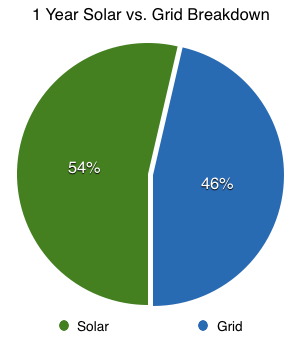 The far right column shows the percentage of solar versus grid energy used. The peak for solar percentage was 72.5% in April, when mild temperatures and sunny days kept energy demand low and production of the panels high. The worst performance was 35.5% solar in December, when skies were often cloudy and colder temperatures meant our electric mileage of our Volts was low, so electric demand for charging was greater. How these two sources would compete, month by month was a mystery to me, until I had the data in hand. Of course, this was after I’d had the panels for an entire year, so this insight came too late to help inform our decision on whether to add the panels or not. Another bit of data gleaned: I could see exactly how the two sources of power ranked. 54% of the electricity we used came from the solar panels and 46% from the grid (by kWh).
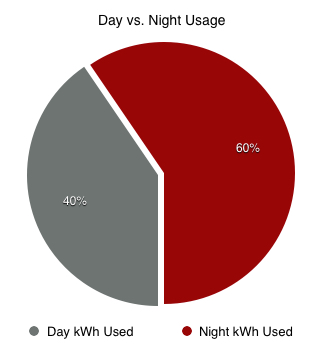 The day/night section I added to the spreadsheet allowed me to easily see when we use electricity and it was a real eye-opener. Unlike most people, in Texas, our energy usage is biased to nighttime use. We have up to three Chevy Volts charging at night and those can account for over half of our total usage, on some days. This makes the time-of-use plans look very interesting. It also means we should possibly be evaluating battery storage, in the event we select a plan that doesn’t offer surplus energy buy-back.
So finally I had come to the moment of truth: Was it a good idea to go solar or not? To get to the answer, I created yet another table that analyzed the financial side of this. There were basically a few things to compare:
- The actual cost over the last year, compared to energy purchases without panels,
- Comparing time-of-use plans to energy purchases without panels,
- Comparing time-of-use plans to plans with or without solar surplus buy back.
Here’s that table: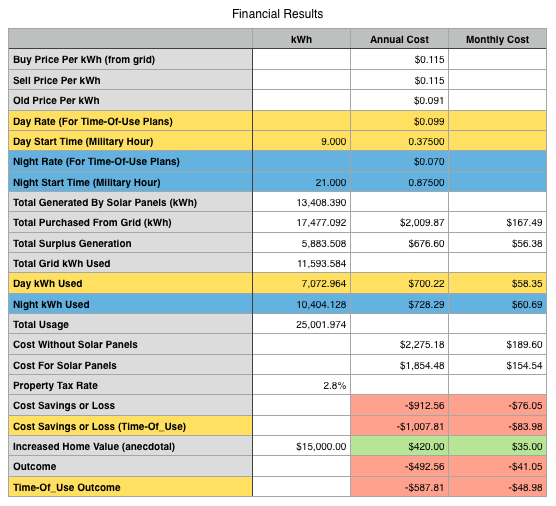 Here’s what you’re seeing in the table above:
The first three rows are are the price to buy electricity, the price the electric company pays for surplus energy generated by the solar panels (which can be zero for some companies) and the price I’d be paying if I did not have the solar panels.
The next four rows (blue & yellow background) are the day and night prices for a company that offers time-of-use pricing and the start and end times for the night pricing. Those companies typically do not have a buy-back of surplus energy.
The next four rows are how the year actually went in kWh usage as well as the costs associated.
The next two rows (blue & yellow background) are the costs involved with time-of-use providers.
The “Cost For Solar Panels” row is the monthly payment for our solar panels, after applying the 30% Federal Income Tax Credit. This payment has to be taken into account, as a cost of energy used, if I’m being completely honest with myself (and you).
The next line is interesting. In Texas, adding solar panels to a home, on average, increases the value of the property by $15,000 but the state does not tax that additional property value. This tax savings has to be considered as a reduction to my costs and therefore an energy savings. The $15,000 increased value, in my opinion cannot be considered, since it won’t be realized, until we sell our home and move away.
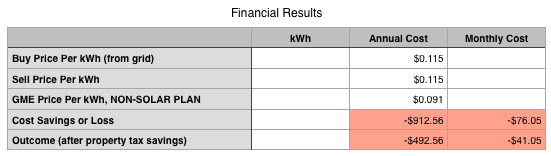 As can be seen in the partial table above, we are paying $76.05 more for electricity, per month, than we did without the solar panels. For all the comparisons below, I am using the non-solar panel plan from Green Mountain, so everything, including our last year’s results, are being compared to the same benchmark. The tax savings amount to $35 per month, reducing this deficit to $41.05 per month. The cost of the solar panels, after tax credit, was $23,436, which we financed over their 20 year warranty period.
Next, I compared The free nights from TXU. There are three possible start times, 8PM, 9PM or 10PM. All have 9 hours of free energy. All three plans would cost us more than Green Mountain’s current non-solar rate by $104.56, $113.44 and $121.72, respectively. Since the buy-back plan is only $76.05 over the non-solar plan and because TXU’s plan is only 10% renewable energy, this is a non-starter for us. (see below)
8PM start:
9PM start: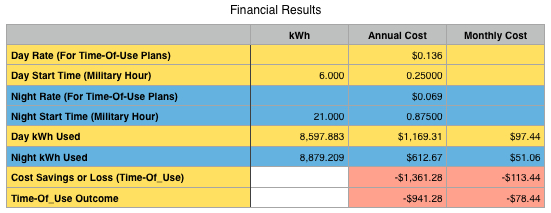
10PM start: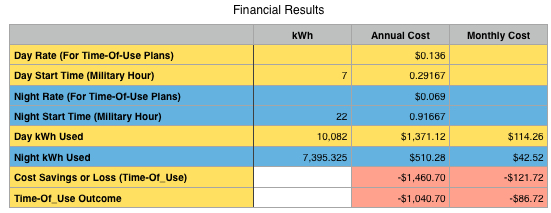 Next up is Volt’s reduced price nights plan, which uses 100% renewable energy. Even this plan is more expensive than Green Mountain’s solar buy-back, by about $6 per month.
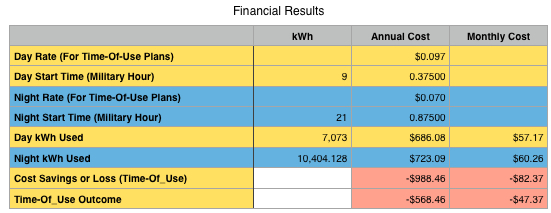
Are you starting to see why I love my spreadsheet?  With this tool, I will be able to realistically compare plans, based on our actual usage scenario. These plans used to be completely opaque to me.
Part of the expected payback is the expected rise in the cost of electricity. Only time will tell if that comes to pass. When we first selected Green Mountain Energy as a 100% renewable energy provider, about 15 years ago, we paid a premium for their product. In time, it became competitive and I feel the early adopters, like us, helped Texas become the number one state in wind-generated electricity. Once again, I’m on the bleeding edge, and am proud to be so.
P.S. I am now very interested in battery backup technology for my solar panels…once they become more affordable. I’m also considering adding more panels when they come down more in price.

Great write-up! Have you checked your estimated production using PVWATTs (http://pvwatts.nrel.gov)? It would to compare PVWATTS estimate to your actual production and the solar company’s estimate. It seems that your actual coming in 15% below the solar company’s estimate means something might not be working right. Give me a call to discuss when you get a chance!
Shine On!
Larry Howe
Please consider appending an executive summary.
We just bought our first home this past December! No more renting or sharing our car charger with other residents! And we are considering solar. We live in Garland so we don’t have the option of choosing a “green” plan from another energy company.
I think Solar would work well for us. The best roof space we have faces south. And our home is all electric (no gas). We already have an appointment set up for Solar City to come out at the end of March to take a look at the property.
With a PHEV we charge every day and a BEV I charge twice a week, I can see solar paying off in the long run. But I’ll need to crunch the numbers and analyze our electric bills over the first few months we live here.
Love the write up thank you. I was looking for real world results like this. I didn’t see it mentioned what size solar system was installed? Could you let me know?
I’m trying to gauge system size to actual results like your 13,000 kWh annually.
According to the blueprints submitted to us, the system was rated at 10.83 kWp. One thing to remember: Our roof primarily slopes in the east and west directions, meaning we do not get full production. If you can place all your panels facing south, you should produce more energy than we are.
We use MP2 Electric for our Solar Buy Back – our rate is 7.7c and they buy back at the same rate, much better than Green Mountain!
When we got our solar panels, they did not have that rate. I just called MP2 and their current offer, in my area, is 9.2₵ per kWh (including the Oncor delivery charge) and the price is locked in for 60 months. I asked for 100% renewable energy, when supplied by MP2, so that may be part of the difference. Is your plan 100% renewable energy?
Still, that’s better than what we have with Green Mountain Energy. I’m checking now to see what it’ll cost to switch.
I was in about the same boat as you. I have a BMW i3 and a Ford Focus electric. I charge them at night where I live in Houston so that they are mainly charged by wind power. I did a search for Texas time-of-use plans and stumbled across a company called griddy. They charge you the actual wholesale rate of electricity and a $10 fee per month. That way when I charge it night it is really cheap. And the daytime rate is only the price of electricity at the wholesale rate. I am right now looking into adding some small solar panels to my roof probably a 2 kilowatt system which will hopefully knock down some of my afternoon power consumption which is the most expensive. If you look into griddy there is no cost to join and no contract you could try it month to month when your contract expires. And I can post a referral code where we would each get $25 off. One caveat, is that they do not buy back electricity. So I will make my system small enough that I will not often sell back to the grid.
I’ll use my spreadsheet to see how the no-buy-back affects my actual bill. I may take you up on the referral! On your solar panels: I have a link to my provider, in my posts about our solar panels. It will send them an email asking them to contact you.