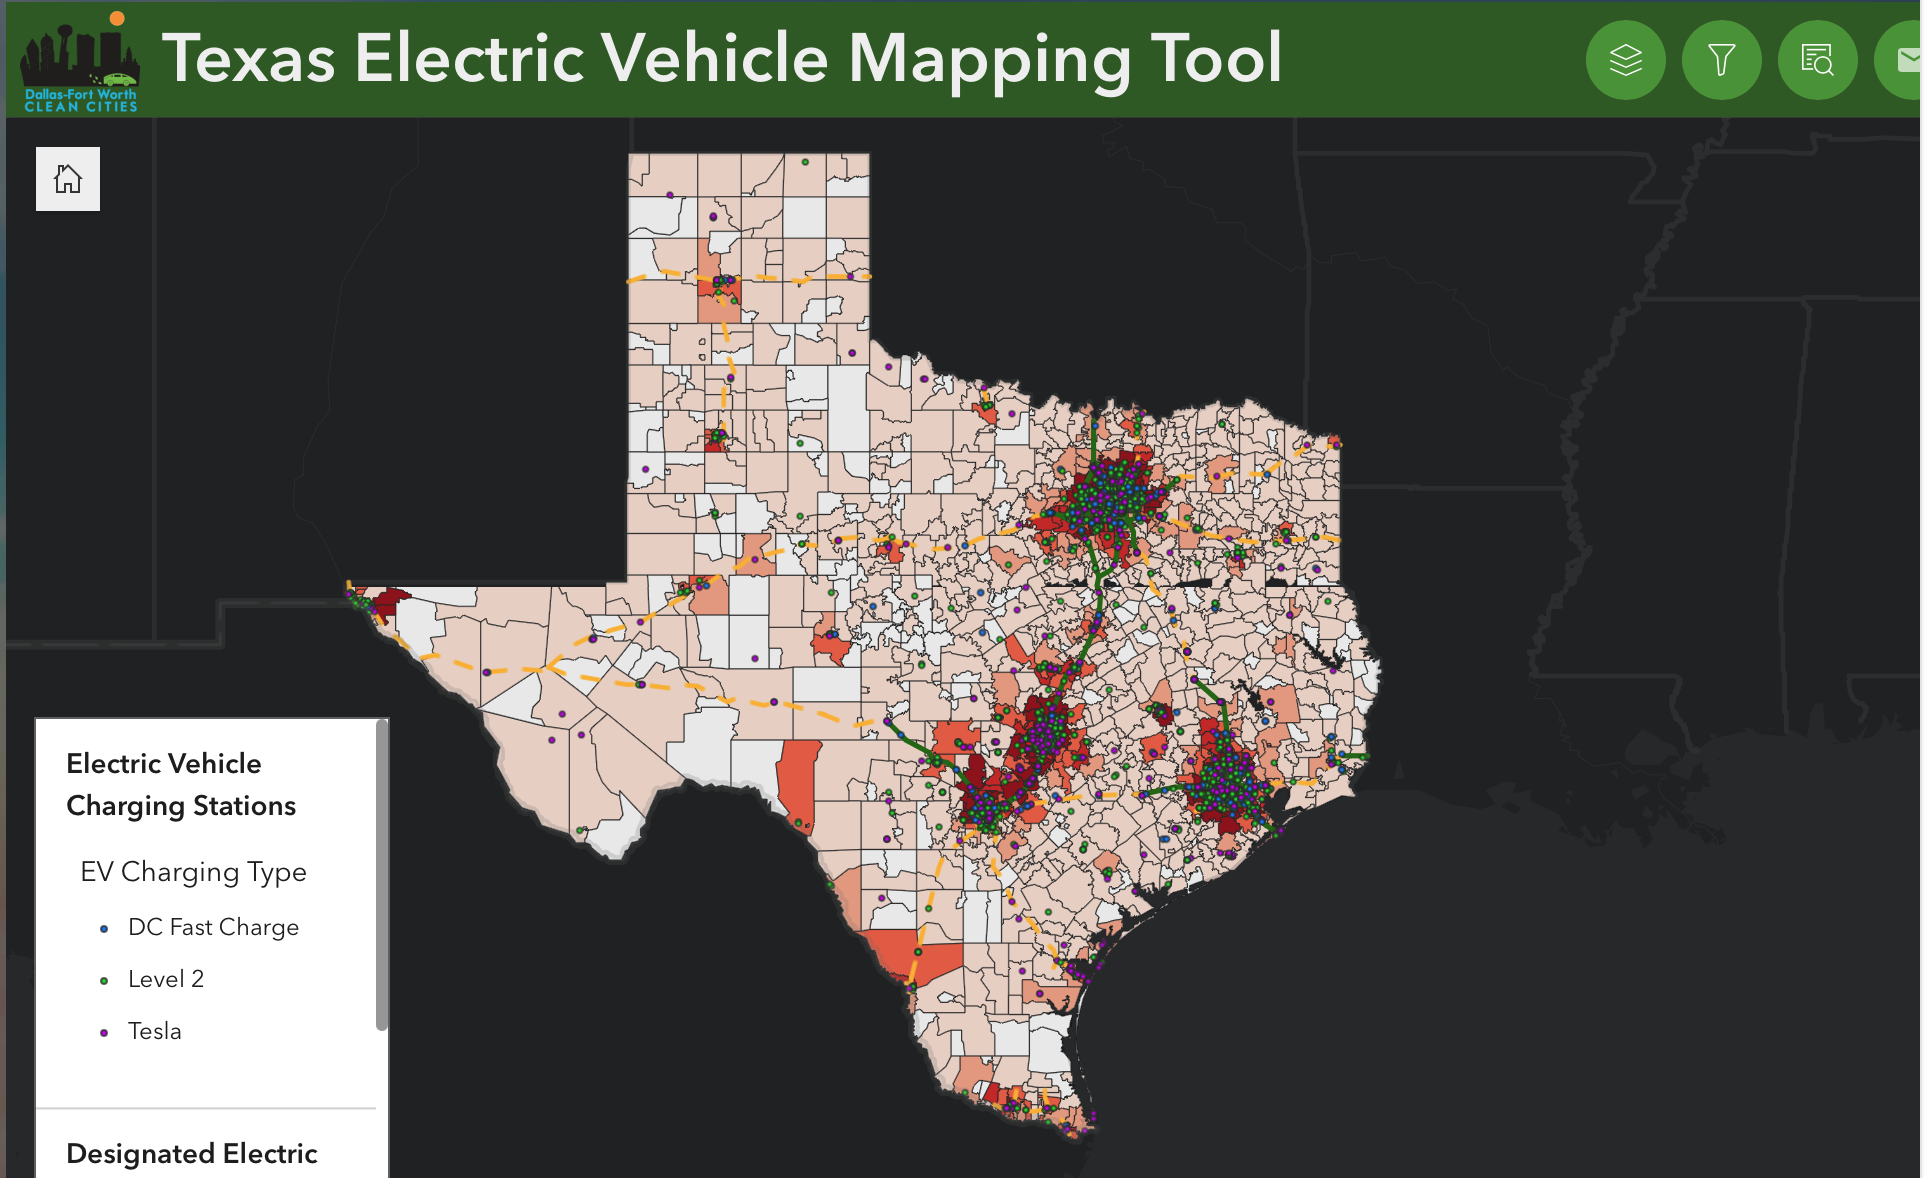
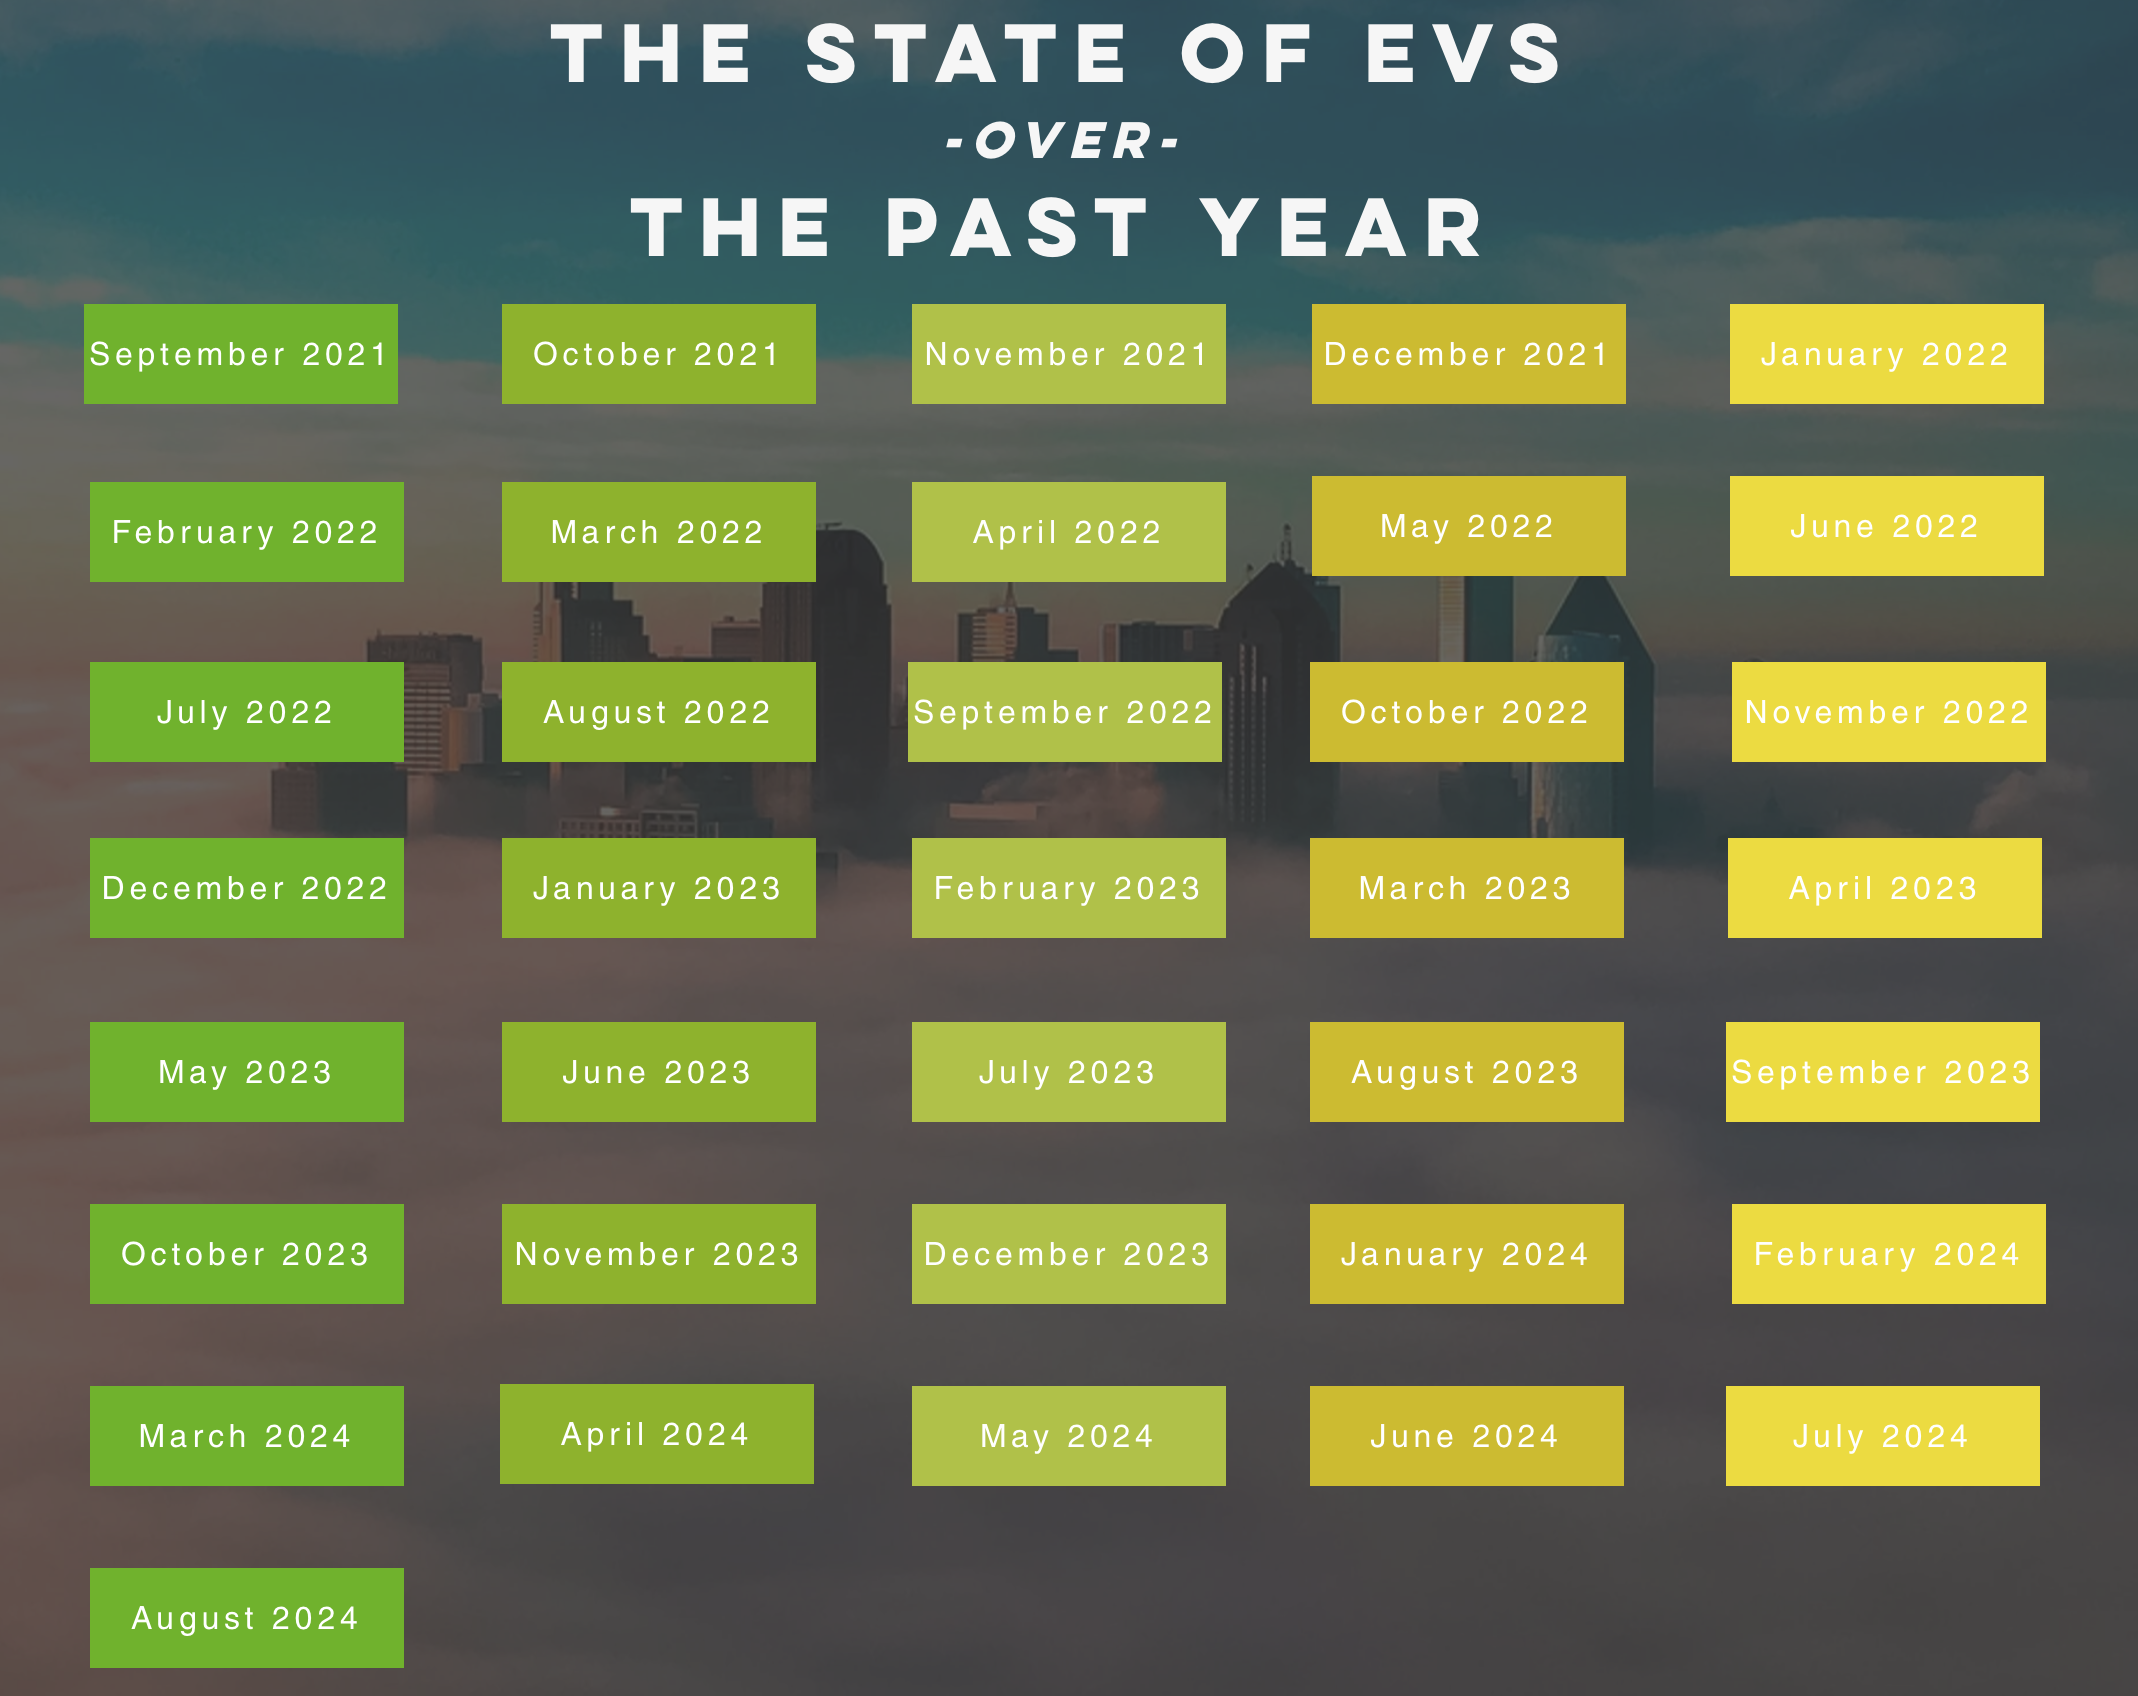
If you haven’t visited the North Central Texas Council of Governments’ / DFW Clean Cities website, you’ve been missing out, especially if you’re a data nerd, like me. There, they have an excellent data map, showing how quickly (and where) in Texas EVs are getting registered. They’re using the registration data in Texas, so they have it displayable on a map by zip code, city, county or region and more importantly, they give you access to the data! If you scroll down, to the bottom of the page, you’ll see a spreadsheet of each month’s data, starting with September 2021 and continuing to the latest month. That’s 36 months of data as of right now.
Each of those rectangles is linked to an Excel spreadsheet that has a row for every zip code in Texas and a column for each model of electric vehicle registered in those zip codes. At the far right, is a summary column that shows the total number of EVs registered in each zip code (or city, county or region on other sheets/tables of the spreadsheet).
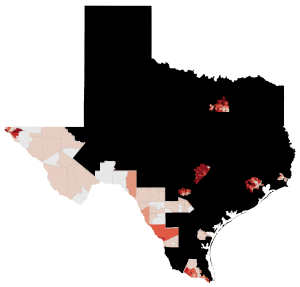
I have been wanting to take each of these static data points and combine them into a single data source that would allow trend analysis. I was particularly interested in finding out a) where the EVs were being adopted and b) how the rate of adoption has been going. I could do this graphically, if I had started when the map was first published, by taking a screenshot of the map each month and using those snapshots to create a time lapse animation. Unfortunately, I did not notice the maps back in September of 2021 and NCTCOG told me they didn’t have the ability to go back and regenerate each month’s maps.
So if I was going to get what I wanted from the data, it was going to require two things: 1) a spreadsheet that combined the data in the existing spreadsheets and 2) a geographic information system (GIS) that would allow me to generate maps from that new spreadsheet.
I started looking around for an affordable GIS system. The last time I used one was back in 1988, when I wrote a converter to translate Arco’s oil well lease map from their internal data format to the format required by a commercially available GIS system.
The GIS world changed a lot in the last 36 years!
I signed up for evaluation copies of two GIS systems. The first one had a display limitation that prevented me from showing more gradations/levels of EV adoption than NCTCOG was showing on their maps. For that reason, I stopped evaluating that package pretty early. The second GIS system I evaluated was eSpatial. eSpatial’s evaluation license included the ability to get answers from their Support team and they were wonderful. My application was a little different from what their customers are usually trying to do, so I had to abandon one way of displaying the data in favor of another they suggested.
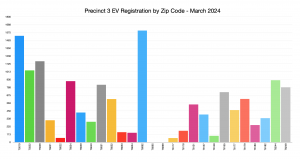
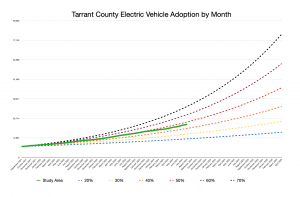
I now have a data source I can use to (relatively) quickly update the data, the maps and the animation video so that I can keep it up to date as each new spreadsheet is published by NCTCOG. Even better, my spreadsheet includes a sheet that allows me to segregate the data in subsets. This allows me to create bar charts and line graphs quantifying the data graphically in very specific areas, to better visualize the trends over time.
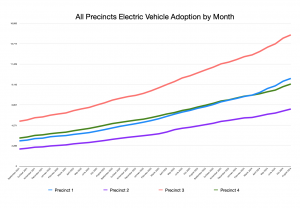
Since TxETRA’s 501(c)(6) lobbies the state government on EV policy, I’ve been particularly bothered by the politicization of EVs. EVs are not partisan! The data and maps have allowed me to show that EV adoption started in areas of higher population, usually in conservative electoral districts and spread from there. Adoption is starting to accelerate in rural areas, starting in the more populous areas, first. The purpose of my work is to show our elected representatives what’s been happening, quantitatively, in their districts.
Democratic districts 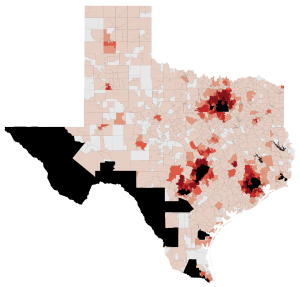
Republican districts 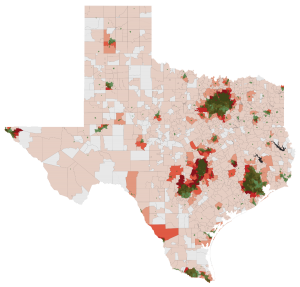
Urban areas (green)
Here’s the resulting time lapse video: