 Swirling around in my head these days, is the idea that a tipping point for EV adoption is rapidly approaching. At first, I thought it might be because I am such a fan of these vehicles that I cannot imagine a world where they would not succeed. So, I just kept those thoughts internalized. Then, Baron Funds wrote the following, in their quarterly report: (bottom-left corner, page 3 of linked report)
“The BMW financial team believes a revolution in drive train is underway. We believe that BMW will likely phase out internal combustion engines over the next 10 years!” (italics and underline added by me)
This generated quite a bit of buzz (not me) in the interwebs. Some people thought this possible, while many others considered the idea preposterous. It reverberated with my own opinion, but what to do? Baron Funds is a globally recognized investment group and I’m just an EV zealot/owner. Of course you know the answer:
It’s time for a spreadsheet!
Yes, instead of just sitting back and letting the math bubble up in my head, I thought I’d sit down on my day off and create a spreadsheet to see just what sort of input parameters would be needed for this revolution to kick into high gear. First, what would the inputs be? Well, here’s a few and my assumptions about them:
- How many cars are there in the U.S.? As it turns out, according to Wikipedia, in 2009, just before the Volt & Leaf debuted, the number of vehicles registered in the U.S. was 254,212,610. I have heard that the new generation, reaching the age to get a driver’s license, are not as interested in cars as previous generations. In fact, it is reported they care more about their connected devices (smartphones, tablets, computers, game consoles, etc) than about owning a vehicle.
- How many of those vehicles could be replaced by a currently available plug-in vehicle? For the spreadsheet, I assumed that plug-ins would never replace 6+ wheeled trucks, motorcycles, “truck combination,” whatever that is… (I’m trying to be conservative here, numerically as opposed to politically) Subtracting those vehicles leaves us with a replaceable total of 235,309,671 back in 2009.
- What percentage of plug-in owners will purchase/lease another EV when it’s time to get a new vehicle? Being an imminently satisfied EV owner, I may be wearing rose tinted glasses here, but my original assumption was 95%. My optimism here may be because I am active in groups that are strong EV advocates, so we should manipulate this to see how it changes projections.
- What is the length of the average lease? I’m going with three years here and that is mainly used to project the number of EVs available on the used market. Did you notice the used market started in 2014 (in the spreadsheet) with an amount slightly lower than 65% of the first year’s volume. More on why it’s slightly lower later…
- What is the length of time an average owner will keep an EV that was purchased new? I used six years for this because I expect advances in technology (battery, charging, safety, infotainment, etc) will get the average buyer to want a new vehicles in about that length of time.
- What percentage of EV customers will lease versus buy? I used 65% lease, 35% purchase simply because that’s what my family did. We leased the first two and bought the third. I believe most of the new buyers will lease, until the masses (and mass media) accept that the technology is sound, as developed as it’s likely to be and here to stay.
- What percentage of EVs will be lost each year from accident? I pulled this number (3%) from my nether regions and have no idea if it’s valid. It’s conservative to guess high so that the final prediction is conservative. This is why the 2014 used EV market is not 65% of the first year’s total EV sales.
- At what rate will EV sales grow? I used 20% because EV annual sales grew 75%, 47% and 27% over the last three years. Many more models are being released this year, so I’m expecting 2015 to maintain the 27%, but we’ll see. Again, this is one we should manipulate to see how it affects our projections.
- Finally, how will the total number of vehicles in the U.S. change year over year? From the same Wikipedia article, the Federal Highway Administration reports that about 3.69 million vehicles have been added each year (on average) since 1960. Yes, there have been rises that were larger and losses some years, but we need a good average growth rate for the spreadsheet. I wanted to use a percentage here, but will go with the stated average from government studies. Again, we should manipulate this to see how it affects things, since if this rate drops, EV percentage of fleet should grow faster.
The totals I used for EVs are only from the vehicles I track monthly, so more plug-in vehicles have been purchased so far than the numbers shown on the spreadsheet. Again, I’d like the projection to be conservative.
The outputs of the spreadsheet are as follows:
- Total vehicles: The total number of vehicles registered in the U.S. As mentioned earlier, using government averages, the fleet will increase in size by 3.69 million vehicles per year (hopefully, those government figures are including attrition of scrapped vehicles…)
- Used market (from lease): Three years after the first release of EVs, we would expect those leased vehicles to enter the used car market. For the purpose of this experiment, we’ll assume no lessee decided to keep their leased vehicle, but instead let it go back to the leasing company, which made it available as a used car. To account for attrition, the loss percentage was used to determine the number of the leased EVs that would have been destroyed, leaving this number for resale.
- Used market (from purchase): Six years after the first release of EVs, we would expect those purchased vehicles to begin to enter the used car market. For the purpose of this experiment, we’ll assume no purchaser kept their EV more than six years, but instead traded it in or sold it to someone else, which made it available as a used car. To account for attrition, the loss percentage was used to determine the number of the purchased EVs that would have been destroyed, leaving this number for resale.
- Total EVs: Total of all the used and new EVs on the market, accounting for attrition.
- Total fleet percentage: The percentage of all registered vehicles in the U.S. that are EVs. This value changes very slowly, due to the lifespan of all those old gasoline-powered in the US fleet.
- New car percentage: Percentage of new car purchases that are EVs.
Finally, if the percentage of EV growth in new car sales causes the number of new EVs to exceed 3.69 million (the theoretical total new car market size, mentioned in the last bullet point above), then growth in EVs is capped at 3.69 million. We should note when this occurs as it shows the date that 100% of new purchases/leases that can be replaced by EVs have been replaced.
So here’s how it worked out: (click on each spreadsheet to see a larger image)
Projection One (worst case???)
I have a friend who is in the automobile business but very anti-EV (believe it or not, I am a very tolerant person…) I asked him for the inputs, expecting his to be very conservative. After cracking a few jokes about EVs, he came up with the following assumptions:
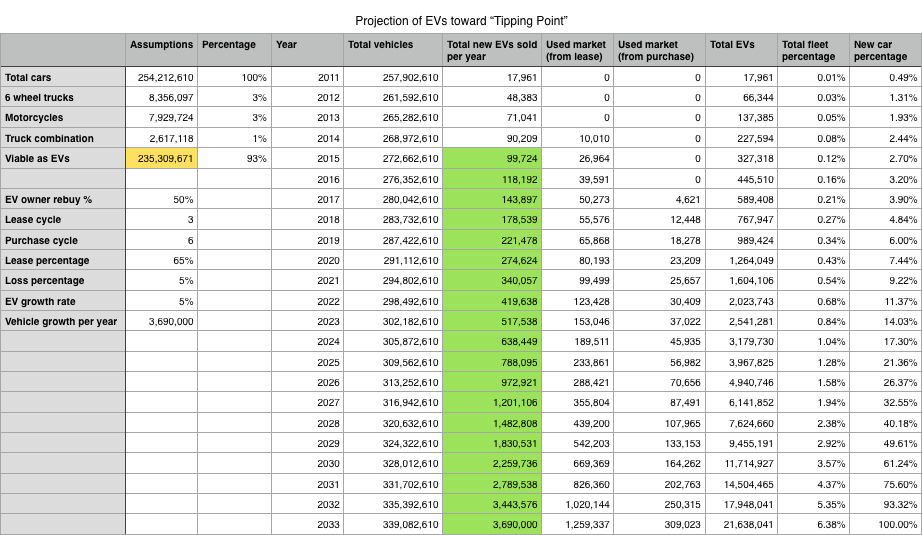
- percentage of EV owners who will get another EV: 50% (yeah, right)
- percentage of cars destroyed or scrapped each year: 5%
- growth rate of EVs: 5% (so far it has always been in excess of 25%, but it’s a new market…)
Those assumptions yielded the following projections:
- It would take until 2033, for the number of new EVs purchased per year, to reach the average new purchase total of 3.69 million vehicles, or 100% of all new vehicles purchased. That’s eighteen years from now.

Projection Two (middle case)
I next, came up with my best case scenario (to be revealed later) and used the best case and worst case to come up with the following, middle of the road, assumptions:
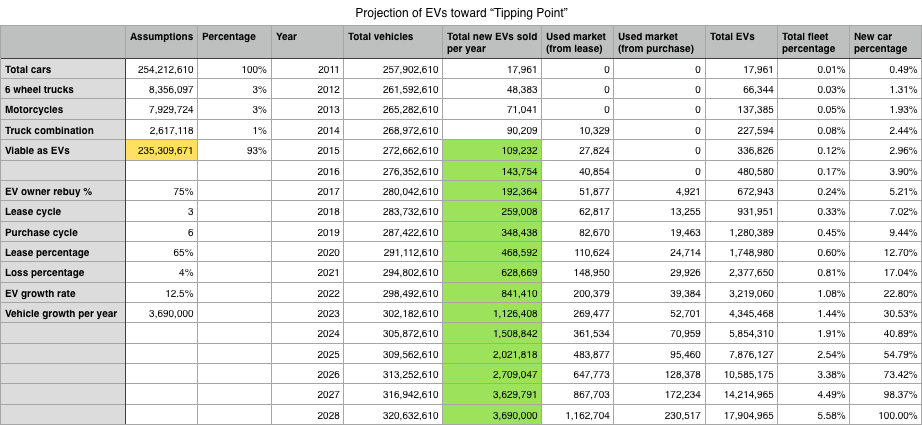
- percentage of EV owners who will get another EV: 75% (this seems way too low to me)
- percentage of cars destroyed or scrapped each year: 4%
- growth rate of EVs: 12.5%
Those assumptions yielded the following projections:
- It would take until 2028, for the number of new EVs purchased per year, to reach the average new purchase total of 3.69 million vehicles, or 100% of all new vehicles purchased. That’s thirteen years from now.
 Projection Three (best case?)
For my best case scenario, I used the following assumptions:
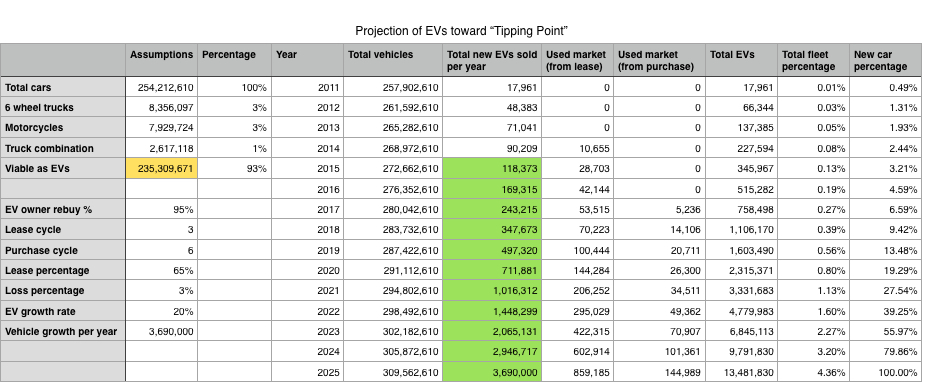
- percentage of EV owners who will get another EV: 95%
- percentage of cars destroyed or scrapped each year: 3%
- growth rate of EVs: 20%
Those assumptions yielded the following projections:
- It would take until 2025, for the number of new EVs purchased per year, to reach the average new purchase total of 3.69 million vehicles, or 100% of all new vehicles purchased. Oddly, this matched the original projection, from Baron Funds, of the year they predict BMW will cease to make vehicles with internal combustion engines. That’s ten years from now!
 Obviously, I haven’t accounted for everything. It’s a spreadsheet! One of the glaring omissions is the coming end to EV subsidies. Surely that will impact new EV purchases and therefore the projections of the spreadsheet. Since it is a planned tapering off of incentives, rather than a sudden stoppage, my gut feel is it will have a negative effect on EV adoption but (hopefully) that will be ameliorated by increased manufacturing efficiencies causing EVs and gasoline-powered vehicles to achieve price parity. Another glaring omission is the acceleration toward EVs that will occur, once the market shows it is heading in that direction. Manufacturers will begin to discontinue gas vehicle sales (where EVs are suitable), further increasing the new EV purchase percentage. What happens if the price of gasoline goes into rapid, severe decline? Do people go back to buying gas-powered cars because EVs no longer have an economic advantage? My gut tells me no, because as the price of oil drops, it will become too expensive to truck it to all the service stations that exist today. There just won’t be enough customers or profit to make it worthwhile, which is the conundrum faced by those trying to establish vehicle charging networks today. That may cause an accelerated depreciation of gas-powered vehicles, which could have the effect of making people look at EVs more seriously than they had up until that point. I also think that many will have my view, that the experience of driving an EV is so superior to an internal combustion vehicle, that people will stay with the new paradigm because it is qualitatively better.
I built this spreadsheet pretty quickly and have gone over the equations for about a day now. Although it won’t prove to be accurate, it has opened my eyes to the fact my subconscious mind has known for a while: There’s a storm coming. I am open to trying other’s input values as well. Feel free to let me know what your values would be and/or what assumptions I’ve made with which you strongly agree or disagree.


I hope you do an in-depth comparison of the new Volt with the previous model–with pictures. Technical details plus aesthetics, fit and finish.